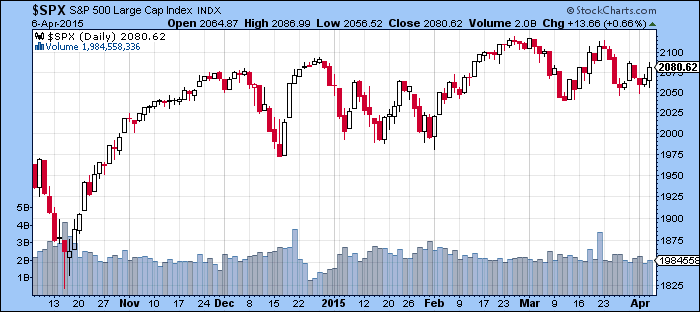
The broader stock market has been moving higher in fits and starts. The market’s primary trend continues to point upwards, although there has been a noticeable change in character. Periods of weakness are sharper with a larger number of shares being distributed than before.
Further the meltup like gains with stocks grinding to new highs, day after day, following shallow pullbacks seems to be no more as of 2015. And it would make sense with the Federal Reserve having changed course from open ended QE to now discussing interest rate hikes that it would cause some shifts in investor behavior.
This change will certainly create more opportunities on the short side. However in the near term, there seems to be more upside on the long side given the strong price action in the face of a weak jobs report. Market breadth as measured by the New York Stock Exchange Advance Decline line also moved up to a new high. More often than not, breadth follows price rather than breadth following price.
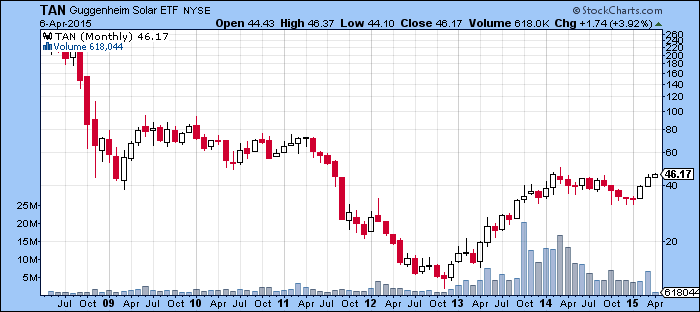
One of the areas of the market showing the most bullish price action are solar stocks. While the market has vacillated within a 5% range over the last two months, solar stocks have moved higher and consolidated their advance. 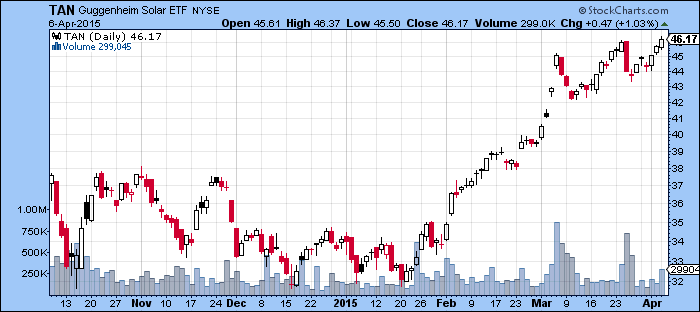
Guggenheim Solar (ARCA:TAN), the solar ETF, is also inching to another breakout while demonstrating increased volume on up days. With the assumption that the market continues its advance, this sector look like an interesting group for low risk entries.
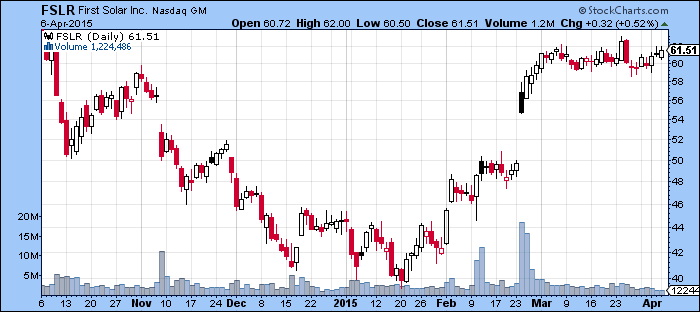
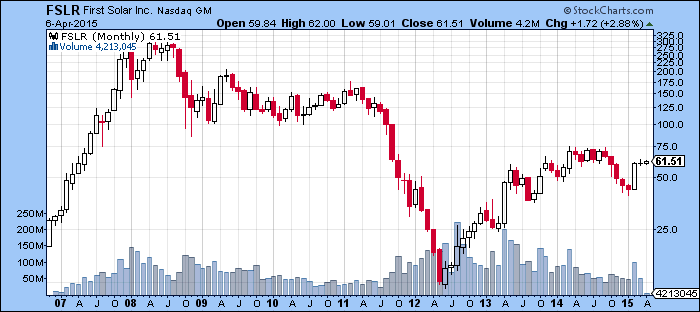
First Solar (NASDAQ:FSLR) is another stock that has been consolidating in a tight pattern, following a more than 50% move higher from its 2015 low. This tight consolidation is more meaningful given its behavior while the broader market was volatile. Instead, this has the look of a stock that remains under accumulation despite its gain.
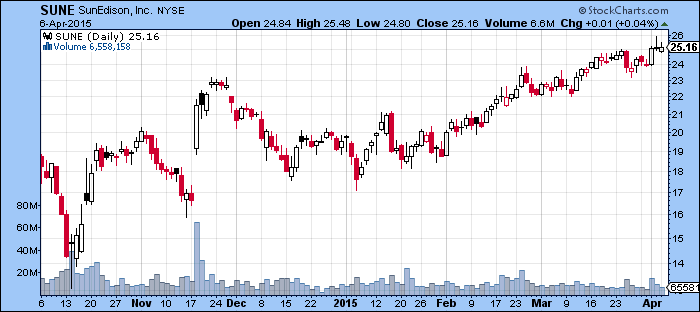
Sunedison Inc (NYSE:SUNE) is another stock that is on the cusp of a breakout and demonstrating very strong price action. Stocks breaking out to new highs in the early stages of a broad market advance is one indication of a leading stock.
Besides these technical charts, these stocks are reasonably valued. For one, as a group they remain closer to March 2009 lows and lower in some instances. Needless to say most components of the market are past the highs of the previous bull market.
Fundamentally, the stocks are actually value plays albeit with impressive growth. FSLR has a price to earnings ratio of 15 while growing sales 30% on a quarter over quarter basis. In this market, it is rare to find this type of growth priced so cheaply.
All of the major players in this sector like SUNE, Canadian Solar Inc (NASDAQ:CSIQ), TSL, SunPower Corporation (NASDAQ:SPWR) are reasonably priced by traditional metrics and growing sales double digits. In a stock market awash with liquidity, with very few opportunities for organic growth, its not unusual to see overvaluations in these areas like social media and biotech stocks.
With solar costs plunging and reaching parity in many areas of the world, it actually has the chance to transform the way we live and do business. I believe there is a strong short term, technical case to be buying here and a longer term one as well.
- English (UK)
- English (India)
- English (Canada)
- English (Australia)
- English (South Africa)
- English (Philippines)
- English (Nigeria)
- Deutsch
- Español (España)
- Español (México)
- Français
- Italiano
- Nederlands
- Português (Portugal)
- Polski
- Português (Brasil)
- Русский
- Türkçe
- العربية
- Ελληνικά
- Svenska
- Suomi
- עברית
- 日本語
- 한국어
- 简体中文
- 繁體中文
- Bahasa Indonesia
- Bahasa Melayu
- ไทย
- Tiếng Việt
- हिंदी
Solar Stocks Setting Up
Latest comments
Loading next article…
Install Our App
Risk Disclosure: Trading in financial instruments and/or cryptocurrencies involves high risks including the risk of losing some, or all, of your investment amount, and may not be suitable for all investors. Prices of cryptocurrencies are extremely volatile and may be affected by external factors such as financial, regulatory or political events. Trading on margin increases the financial risks.
Before deciding to trade in financial instrument or cryptocurrencies you should be fully informed of the risks and costs associated with trading the financial markets, carefully consider your investment objectives, level of experience, and risk appetite, and seek professional advice where needed.
Fusion Media would like to remind you that the data contained in this website is not necessarily real-time nor accurate. The data and prices on the website are not necessarily provided by any market or exchange, but may be provided by market makers, and so prices may not be accurate and may differ from the actual price at any given market, meaning prices are indicative and not appropriate for trading purposes. Fusion Media and any provider of the data contained in this website will not accept liability for any loss or damage as a result of your trading, or your reliance on the information contained within this website.
It is prohibited to use, store, reproduce, display, modify, transmit or distribute the data contained in this website without the explicit prior written permission of Fusion Media and/or the data provider. All intellectual property rights are reserved by the providers and/or the exchange providing the data contained in this website.
Fusion Media may be compensated by the advertisers that appear on the website, based on your interaction with the advertisements or advertisers.
© 2007-2025 - Fusion Media Limited. All Rights Reserved.

