The last time SNB had to intervene in the FX Market to defend the CHF 1.2000 threshold against the EURO was in September 2012 and it seems like is a matter of days till the SNB will have to take some action again. The Swiss National Bank set the cap in September 2011 after investors anxious about the euro-area debt crisis pushed the franc nearly to parity with the single currency. Now the euro is weakening because of the ECB's loose policy and seems like September 2014 will likely be the moment when SNB will dust the tools to use to defend the threshold.
Is not clear yet if SNB will intervene in the market directly - by selling CHF - or will use monetary policies (like negative interest rates that could discourage investors on buying and holding CHF) but whatever they will decide to do, CHF will have to weaken. Looking at the EUR/CHF weekly chart I am not so enthusiastic about buying this pair at the bottom because is carry trade negative and it could stay at or near the 1.2000 level for months before rising again. I marked on my chart the 01 of September 2012 - the month when SNB made the last intervention and as you can see, previously, the EUR/CHF stood on the "floor" for more than 12 months. I am not saying that this time will be the same but there is a high possibility to see the same scenario if you weight the fact that Mario Draghi is serious about QE in Europe. For me, as for many analysts, the ECB's QE is more like a matter of when will start rather than if will start.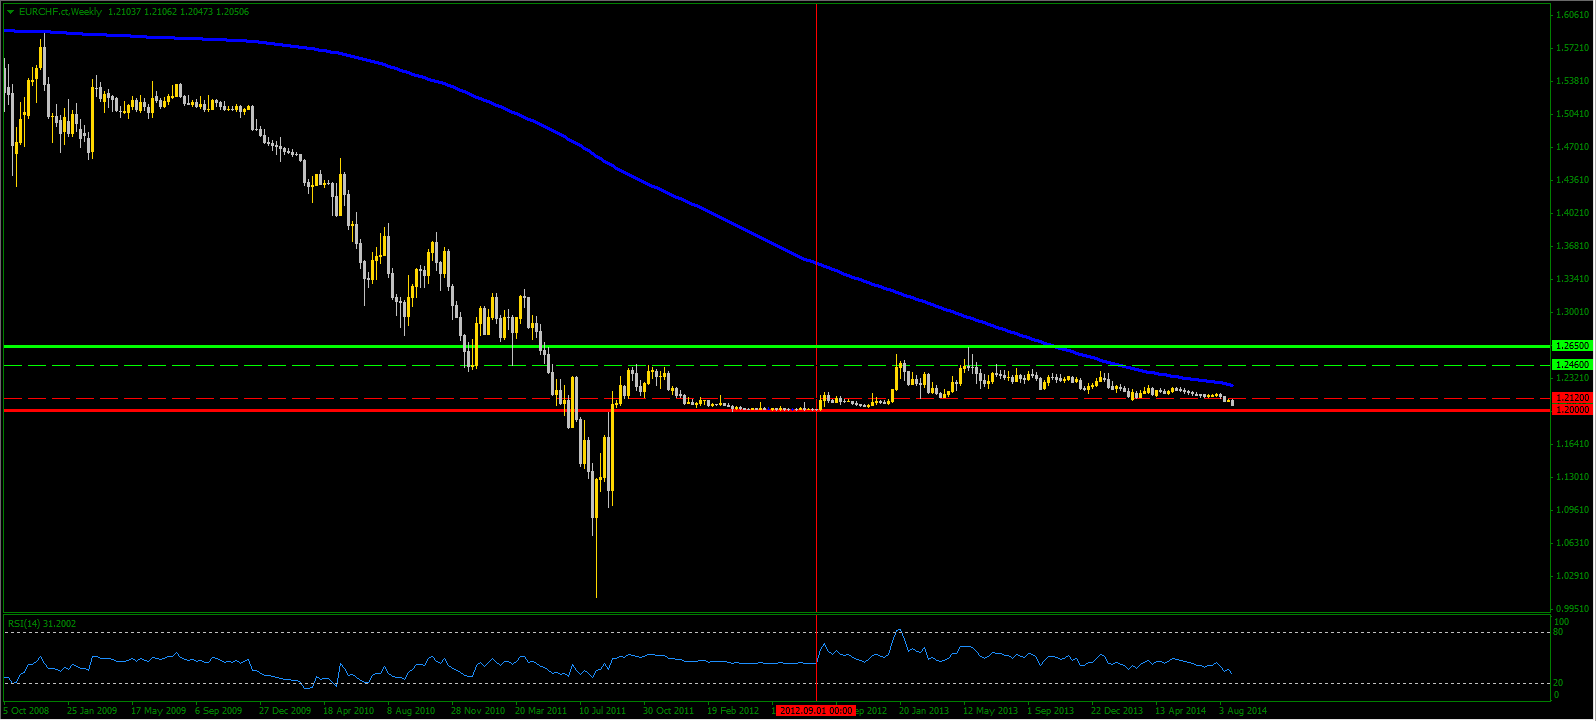
According to my chart, the first resistance to consider is 1.2120 and I think is very unlikely to see EUR/CHF going above that area for the next 6-12 months. If the EURO is to have pullbacks I would consider 1.21200 a good area to sell from. However, looking at January - December 2012 period, I would rather prefer to stay out of EUR/CHF for a while.
How can we trade this SNB action then? Beside considering to get long USD/CHF (or to add to your longs) on every pullbacks, there might be another good trade opportunity in the market. The investors are dissapointed by Mark Carney's forward guidance (which should be called "forward confusion" in my opinion) and they are selling GBP although BoE is still in the top of the list as the first G7 central bank to raise the official rate. The last MPC minutes brought even 2 dissenters which voted for a quick rate raise and I expect to see GBP stabilizing in the near future. The problem is that UK Gilts yields are falling at a faster pace than UST10Y yields, making it difficult for the GBP/USD to gain any meaningful upside momentum.
While the GBP/USD, GBP/CAD or GBP/AUD are making new lows and trading with a strong bearish bias, the GBP/CHF has another story. Before getting into details please note the GBP/USD chart below, where I added the GBP/CAD (orange) and GBP/AUD (dark grey). The GBP/USD is trading near the support at 1.6535 and no one would be surprised if it will make another leg down before a serious retracement or why not a reversal. The GBP/CAD just broke a 7 months support at 1.8100 and it has good chances to fall to the next support at 1.7550. GBP/AUD is breaking 1.7730 support and the daily RSI suggest that the bears are in full control, targeting the next support at 1.7420.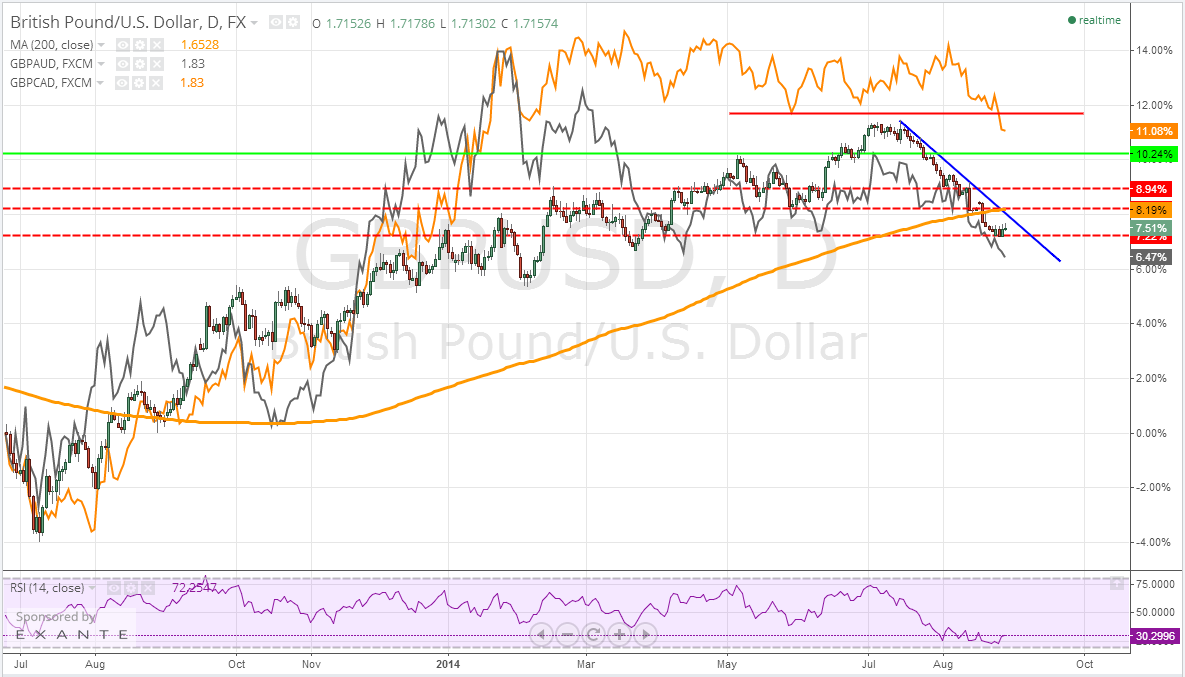
For some reason, the GBP/CHF is not breaking any important support - although the pound is weak against other currencies while the CHF is strong and is trading only 50 pips away from the 1.2000 cap, gaining almost 1% this year against EUR. Actually, the GBP/CHF had a good rally from March till July and in this moment is trading at the 38.2% Fibonacci Retracement of the March-July rally. Traders who are following my analysis already know how important is the 38.2% Fibo Level for a healthy pullback before resuming the rally.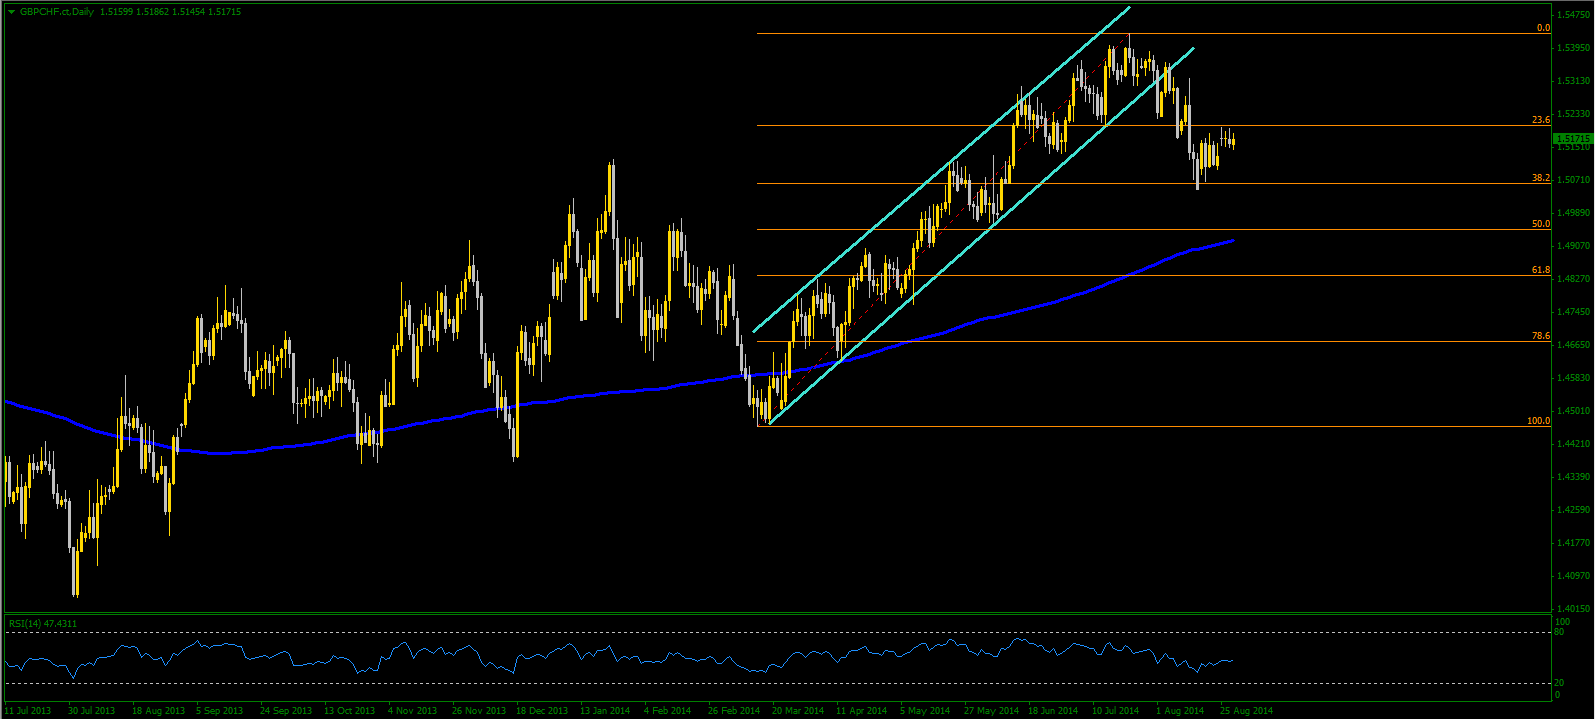
On a larger scale, the GBP/CHF seems to end building a bullish flag which projection targets 1.5800 but not before breaking another strong resistance at 1.5500. Please note how in 2009-2010 period, the 1.5800 level was a strong support and for a short period from the end of 2010 till February 2011 the same level was a resistance.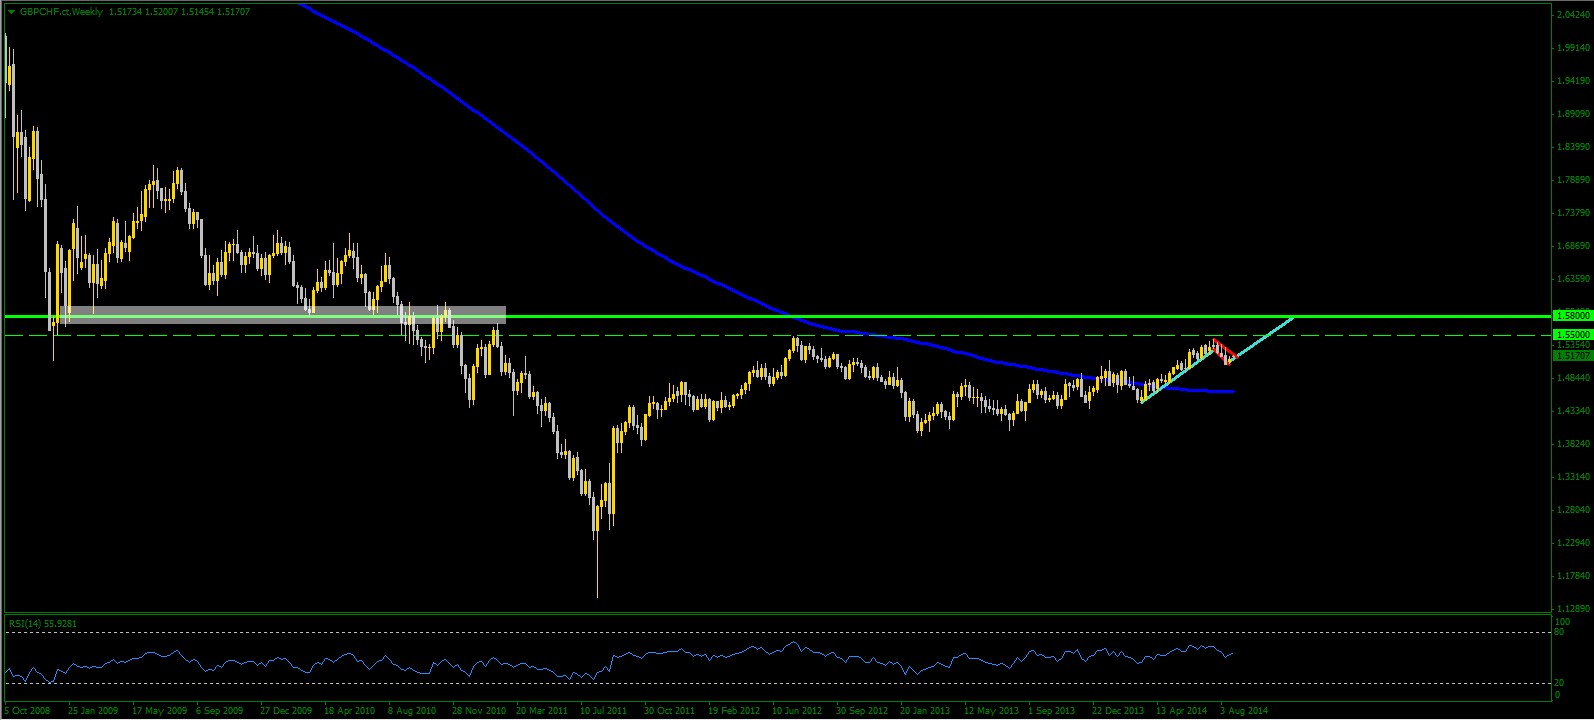
I have to admit that there is another way that you can look at the daily chart of GBP/CHF: bearish flag targeting 1.4835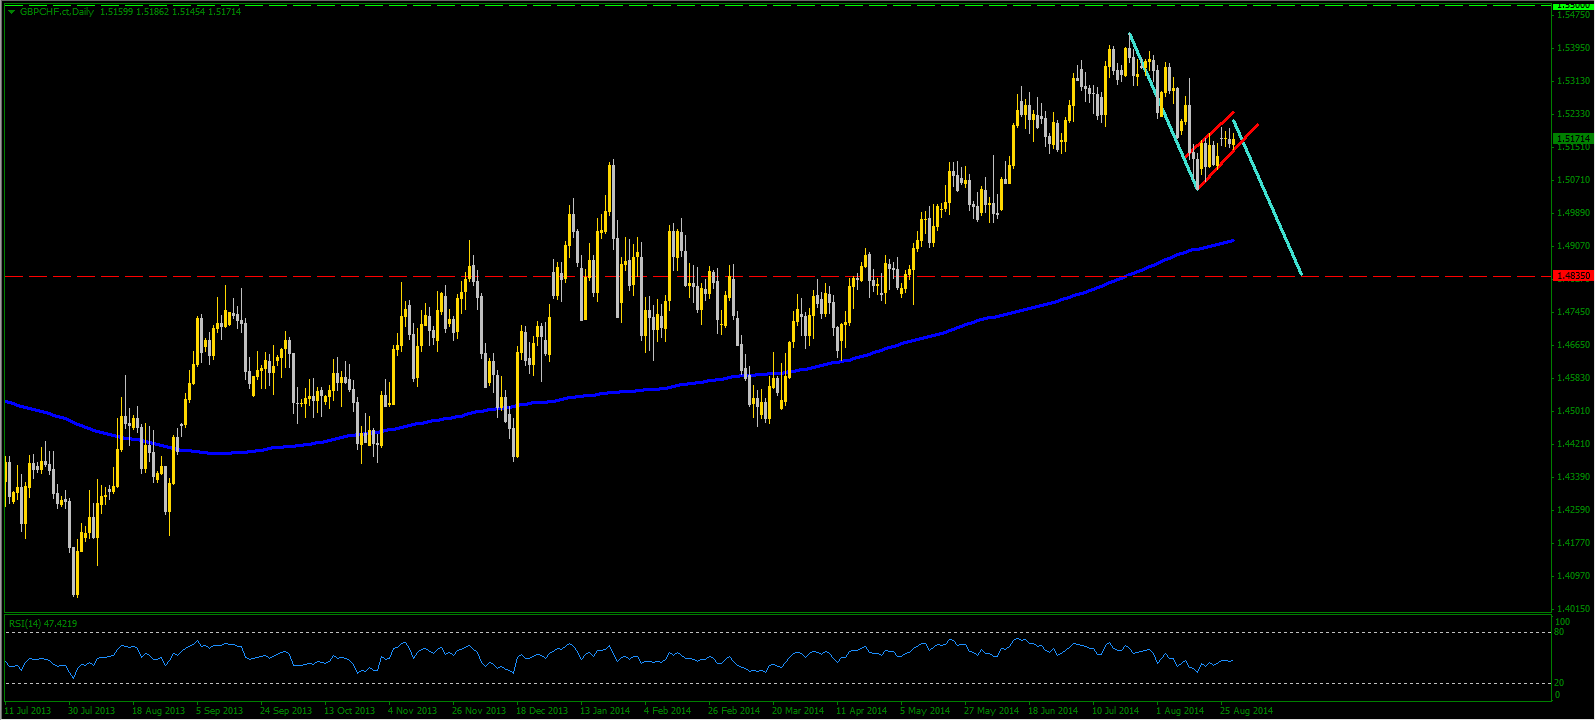
Looking at the EUR/CHF rate action and the increasing pressure on SNB to act, collaborated with the SNB/BoE monetary policies divergence, I am inclined to favorite the weekly bullish flag targeting 1.5800 rather than the daily bearish flag targeting 1.4835. And there is one more thing that makes me to hurry up a little to enter a long position from the current levels:
SEPTEMBER 2011 - SEPTEMBER 2012 - SEPTEMBER 2014 is at the door and the SNB is pressured to open the door, or the currency reserves.
- English (UK)
- English (India)
- English (Canada)
- English (Australia)
- English (South Africa)
- English (Philippines)
- English (Nigeria)
- Deutsch
- Español (España)
- Español (México)
- Français
- Italiano
- Nederlands
- Polski
- Português (Portugal)
- Português (Brasil)
- Русский
- Türkçe
- العربية
- Ελληνικά
- Svenska
- Suomi
- עברית
- 日本語
- 한국어
- 简体中文
- 繁體中文
- Bahasa Indonesia
- Bahasa Melayu
- ไทย
- Tiếng Việt
- हिंदी
SNB Pressured To Take Action
Latest comments
Loading next article…
Install Our App
Risk Disclosure: Trading in financial instruments and/or cryptocurrencies involves high risks including the risk of losing some, or all, of your investment amount, and may not be suitable for all investors. Prices of cryptocurrencies are extremely volatile and may be affected by external factors such as financial, regulatory or political events. Trading on margin increases the financial risks.
Before deciding to trade in financial instrument or cryptocurrencies you should be fully informed of the risks and costs associated with trading the financial markets, carefully consider your investment objectives, level of experience, and risk appetite, and seek professional advice where needed.
Fusion Media would like to remind you that the data contained in this website is not necessarily real-time nor accurate. The data and prices on the website are not necessarily provided by any market or exchange, but may be provided by market makers, and so prices may not be accurate and may differ from the actual price at any given market, meaning prices are indicative and not appropriate for trading purposes. Fusion Media and any provider of the data contained in this website will not accept liability for any loss or damage as a result of your trading, or your reliance on the information contained within this website.
It is prohibited to use, store, reproduce, display, modify, transmit or distribute the data contained in this website without the explicit prior written permission of Fusion Media and/or the data provider. All intellectual property rights are reserved by the providers and/or the exchange providing the data contained in this website.
Fusion Media may be compensated by the advertisers that appear on the website, based on your interaction with the advertisements or advertisers.
© 2007-2025 - Fusion Media Limited. All Rights Reserved.
