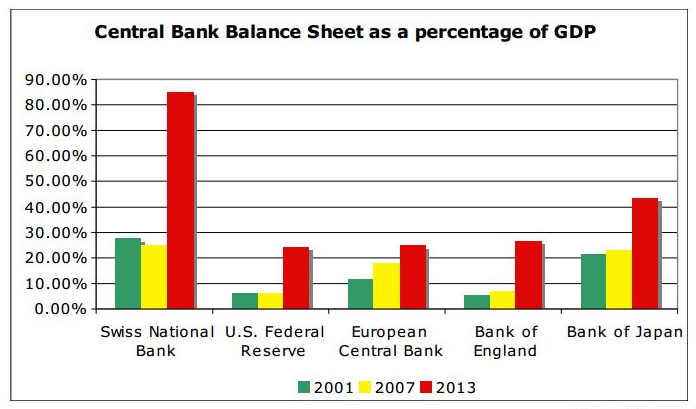
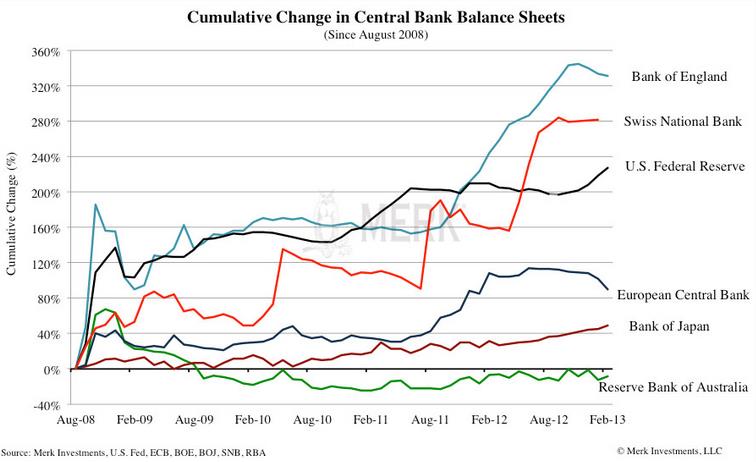
Since 2008 the balance sheet of the Swiss National Bank is 280%, this is the equivalent of 60% of Swiss GDP. So did most other central banks, too. But there is one big difference: The risk for the SNB is far higher, the SNB possess mostly foreign assets.
via @KoosJansen
The Fed or the Central Bank of Japan mostly own local government bonds, they run an inflation risk but no currency risk.
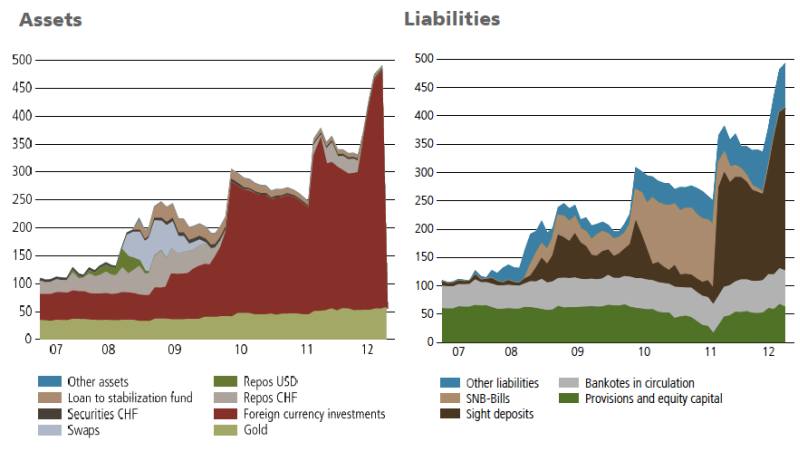
The following graph from UBS shows how the SNB has increased both assets and liabilities, its balance sheet expansion.
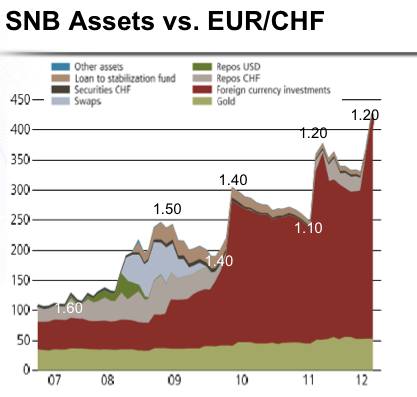
SNB Reserves vs. EUR/CHF (G. Dorgan based on UBS)
We like to compare the increases with the fall of the EUR/CHF exchange rate.
The graph shows that a decrease of reserves was only possible when EUR/CHF appreciated. Maintaining the EUR/CHF relatively stable was only possible when reserves strongly rose.
- Between March and June 2009, the SNB managed to maintain the 1.50 EUR/CHF “line in sand” only thanks to intensive FX intervention.
- Same picture in May 2010: Strong demand for the Swiss Franc, even multiplied by the first Greek crisis. The EUR/CHF fell to 1.40. When the SNB had abandoned the FX interventions the Swiss Franc reached parity with the dollar and EUR/CHF 1.30 in September 2010.
- After the typical US rebound in Q4/2010, the Swissie soared again. Like regularly it reached a first peak in the May 2011 up to a EUR/CHF 1.22 and a USD/CHF of 0.83. Then the increase of the Swiss currency even accelerated to reach EUR/CHF of 1.0076 and USD/CHF 0.71 in August 2011.
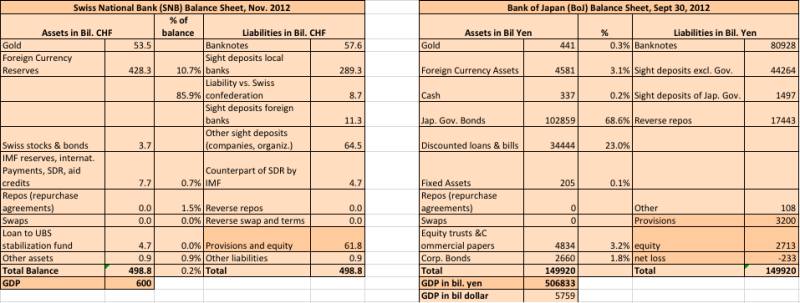
The following tables show the SNB balance sheet in comparison to the one of the Bank of Japan, another central bank that strongly intervenes in markets.
SNB vs. BoJ Balance Sheet (source SNB and BoJ)
Disclaimer: The opinions expressed above are not intended to be taken as investment advice. It is to be taken as opinion only and we encourage you to complete your own due diligence when making an investment decision. Even if we often write about Forex trading, our advices aren't written for day traders who follow technical channels, but rather for mid- and long-term investors. Our aim is to show discrepancies between fundamental data and current asset valuations, which can lead in mid-term to an inversion to technical channels.

