-
US small-cap stocks explode higher
-
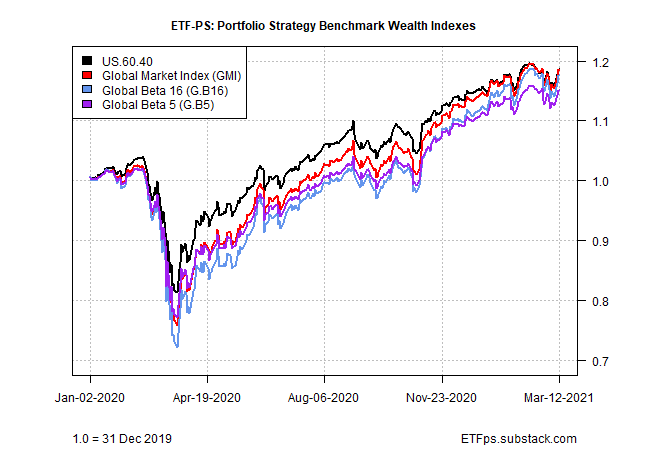
No sign of trouble for our strategy benchmarks, which continue to trend up
The small-cap rocket ship has left the launch pad
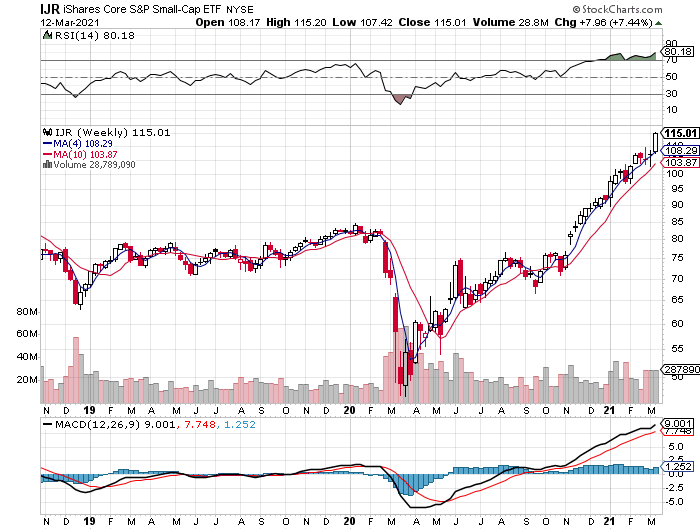
It’s been clear for months that small-cap shares have been on a tear, but even by recent standards last week was impressive.
The iShares Core S&P Small-Cap ETF (NYSE:IJR) roared higher with a monster 7.4% gain for the week through Friday's close (Mar. 12). The gain was easily the strongest weekly advance for our list of ETF proxies representing the major asset classes.
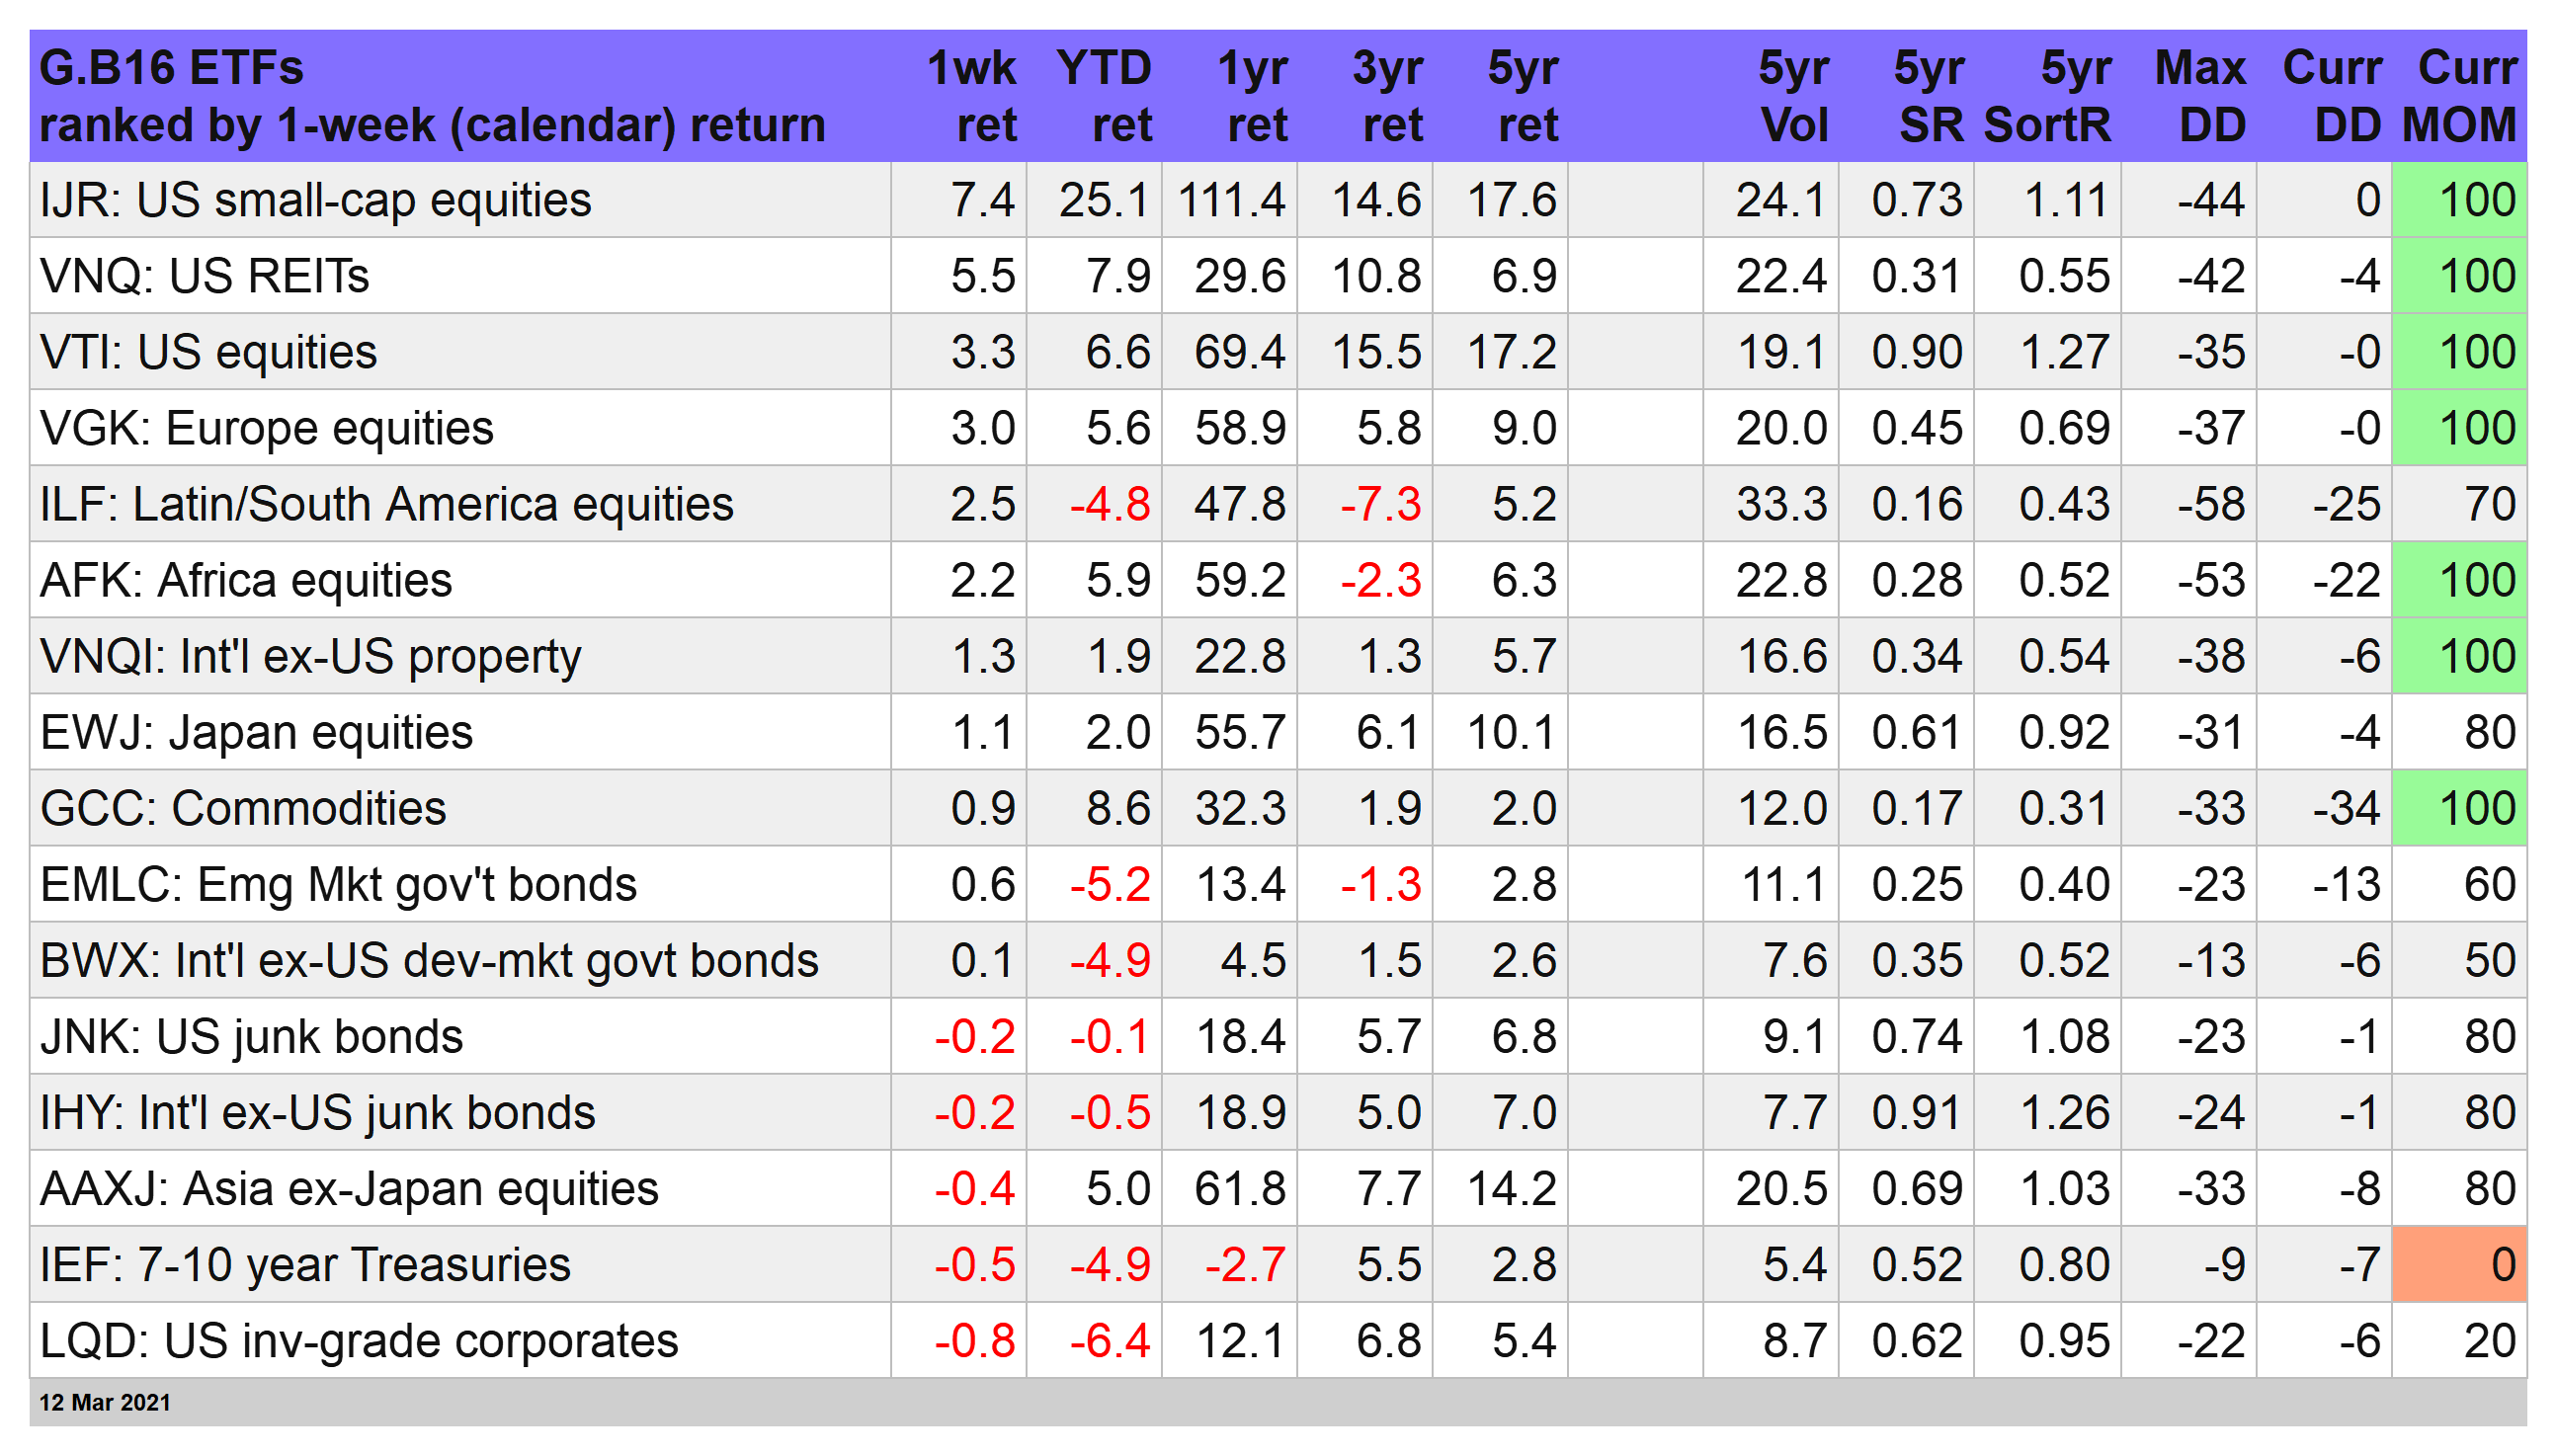
The recent gains now put IJR in the lead for year-to-date, one- and five-year trailing returns (and close to the top for three-year results). But that’s weak tea compared to the edge in the one-year column—a stunning 111% increase for IJR—far above the next-best competitors.
Overall, last week was a mixed week for global assets. Although there was a solid upside bias coursing through markets, the ongoing rout in bonds showed no mercy and most slices of fixed income lost ground last week.
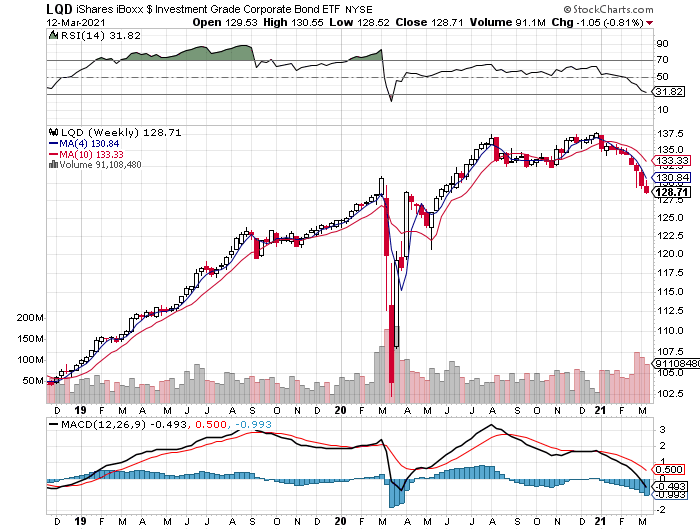
The biggest loser, again—US investment-grade corporates. The iShares iBoxx $ Investment Grade Corporate Bond ETF (NYSE:LQD) fell 0.8%. Not only was that the worst performance for our standard opportunity set this week, the loss marks the fund’s eighth straight weekly decline. Year-to-date, LQD has shed 6.4%, which is also the deepest decline so far this year for the funds in the table below.
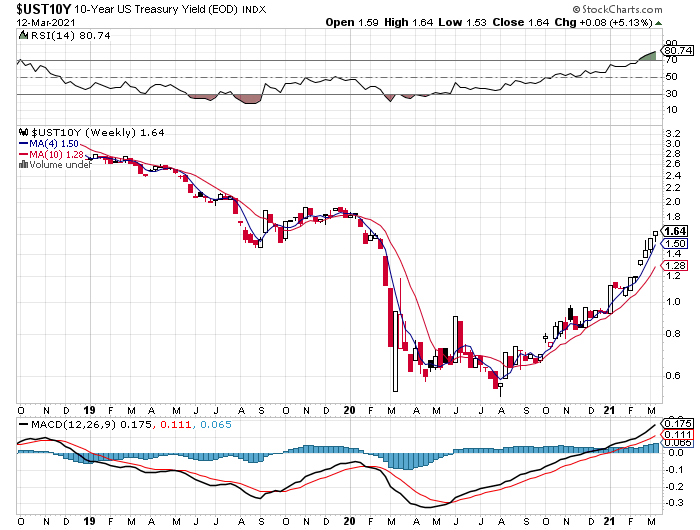
The source of pain for bonds generally, of course, is the ongoing rise in interest rates. The 10-year Treasury yield continues to push higher, for example, rising to 1.64% at the close of trading last week—the highest since January 2020.
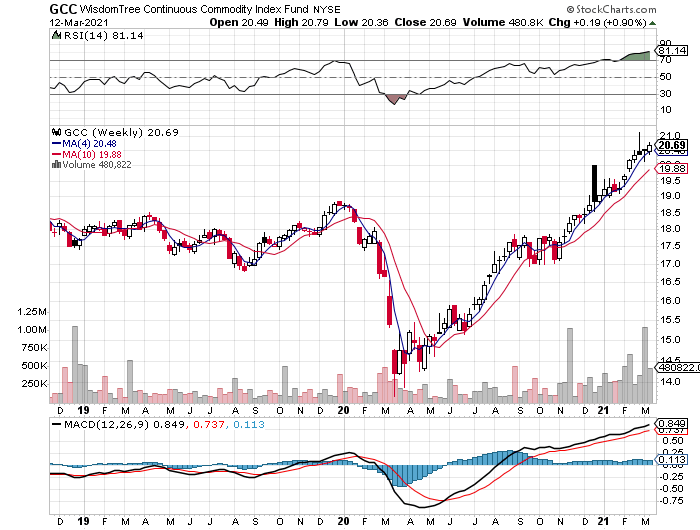
While higher yields are weighing on bonds, the repercussions remain bullish for commodities, presumably on the assumption that yields are rising on firmer expectations for inflation, which in turn juices the outlook for prices of raw materials. Whatever the reason, the equal-weight WisdomTree Continuous Commodity Index Fund (NYSE:GCC) rose 0.9% last week, scoring its seventh-straight weekly increase.
Smooth sailing for strategy benchmarks
The troubles in the land of bonds has yet to take much of a bite out of our standard portfolio benchmarks. No doubt the returns are lower than they would be if fixed income wasn’t ailing, but the results so far this year remain solid nonetheless.
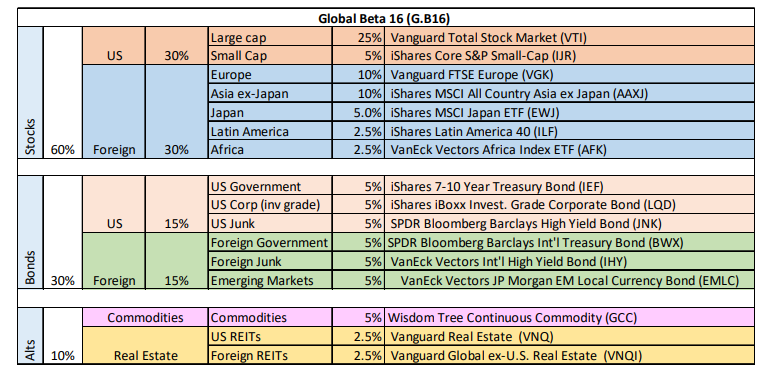
The week’s best performer: Global Beta 16 (G.B16), which holds all 16 funds in the table above in quasi market weights. The benchmark rallied 2.3% this week and for the year is up 4.6%. Far more impressive is the portfolio’s stellar 47.3% gain.
These results can’t be sustained, at least not for long. But as the manna from financial heaven rains down, the beta tailwind makes it easy to look smart with multi-asset class strategies. 
How long can the good times last? Unclear, but with last weekend’s passage of President Joseph Biden’s $1.9 trillion stimulus/relief bill, the risk-on party for much of the past year just got a fresh injection of rocket fuel.
