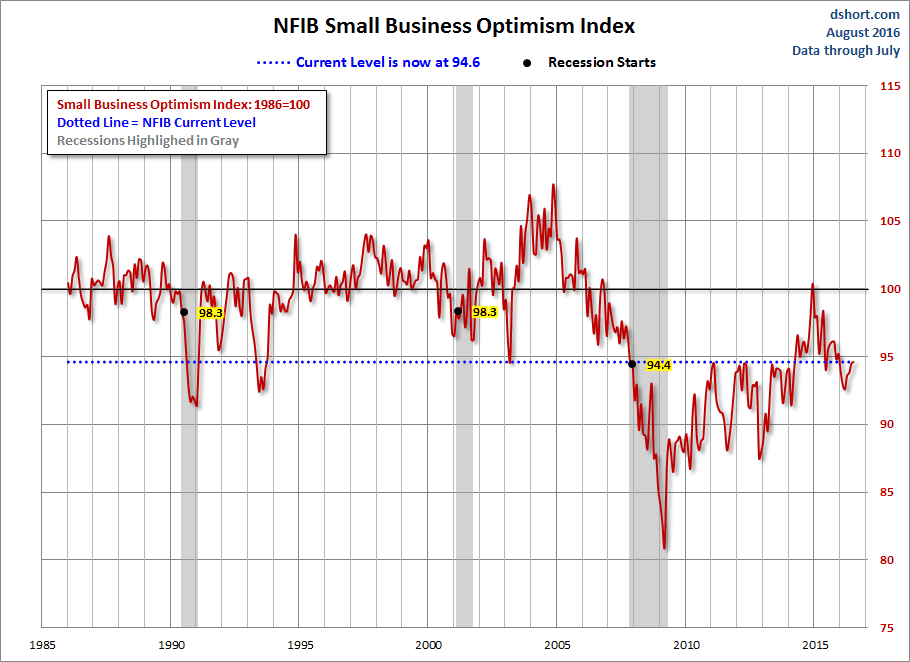
The latest issue of the NFIB Small Business Economic Trends is out today (available here). The September update for August came in at 94.0, down 0.1 points from the previous month. Today's overall number is at the 20.4 percentile in this series -- fractionally above the top of the lowest quintile in the history of this series. Since its initial recovery following its Great Recession trough, this index has been stuck in an extremely volatile range for the past three years. Since January of 2011, it has repeatedly bumped a ceiling around its current level and then retreated.
Here is an excerpt from the opening summary of the report:
Owner optimism went nowhere in August as the Index fell 0.1 points, statistically no change. As "calm" as the Index appears, there was turmoil in the details. Job creation plans jumped 7 points to levels not seen since 2007. Yet, last month firms shed the largest number of employees in months. Capital spending and inventory investment plans increased as well, all activities that would put some energy into GDP growth. But, reports of quarter to quarter net gains in sales deteriorated 17 points and profit trends followed, giving up 13 points. Expectations for business conditions in six months also became more negative. Yet, sales expectations improved 8 points. All of this is a rather perplexing set of statistics; internally consistent on some dimensions as lower sales bring lower profits, but contradictory in other ways with lower job openings but huge gains in hiring plans. The September survey will hopefully straighten this out.
The first chart below highlights the 1986 baseline level of 100 and includes some labels to help us visualize that dramatic change in small-business sentiment that accompanied the Great Financial Crisis. Compare, for example the relative resilience of the index during the 2000-2003 collapse of the Tech Bubble with the far weaker readings of the past four years. The NBER declared June 2009 as the official end of the last recession.
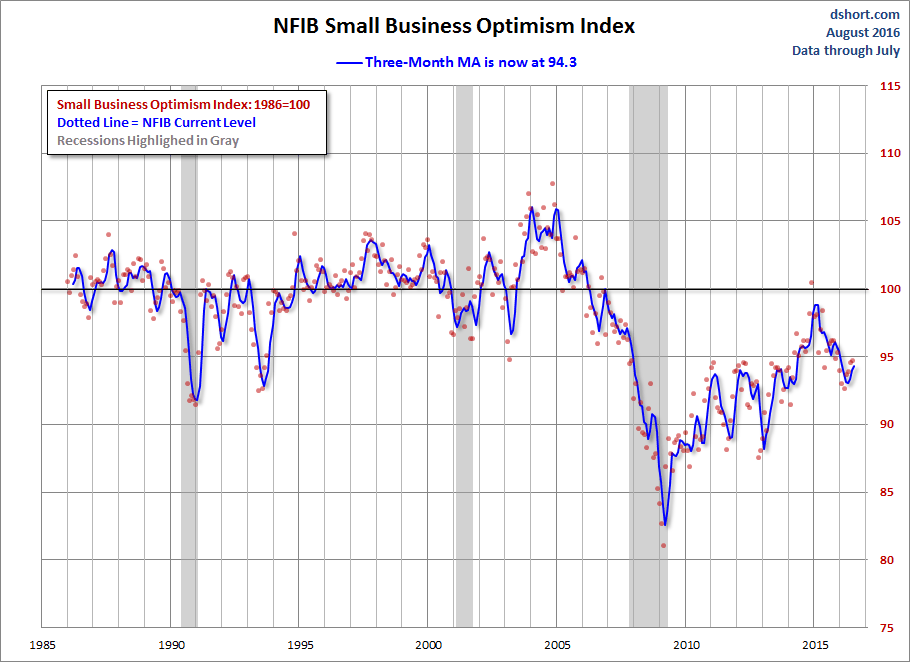
The average monthly change in this indicator is 1.29 points. To smooth out the noise of volatility, here is a 3-month moving average of the Optimism Index along with the monthly values, shown as dots.
Inventories And Sales
The findings on small business inventories and sales continue to underscore the general pessimism of the survey. The excerpts below are from the latest monthly report (PDF format).
The net percent of all owners (seasonally adjusted) reporting higher nominal sales in the past three months compared to the prior three months plunged 17 percentage points to a negative 24 percent, the second steepest monthly decline on record. The net percent of owners expecting higher real sales volumes surged 8 points to 15 percent of all owners (seasonally adjusted), a new high for this recovery. The pace of inventory reduction continued, with a net negative 11 percent of all owners reporting growth in inventories (seasonally adjusted), 1 point worse than July. For all firms, a net negative 1 percent (unchanged) reported stocks too low, an historically “satisfied” reading. The net percent of owners planning to add to inventory stocks rose 3 points to a net 2 percent, in line with an improvement in expectations for sales growth.
Credit Markets
Has the Fed's zero interest rate policy and quantitative easing had a positive impact on Small Businesses?
Seven percent of the owners reported that all their credit needs were not met, up 2 points from July. Twenty-nine (29) percent reported all credit needs met, and 49 percent explicitly said they did not want a loan. Only 3 percent reported that financing was their top business problem compared to 23 percent citing taxes 21 percent regulations and red tape and17 percent citing weak sales. Thirty (30) percent of all owners reported borrowing on a regular basis, down 1 point and historically very low. A net 4 percent reported loans “harder to get” compared to their last attempt (asked of regular borrowers only), down 2 points from July.
NFIB Commentary
This month's "Commentary" section concludes with the following observations:
Overall, the Index of Optimism says the small business sector is going nowhere and that's what it feels like....
Owners reported lousy performance in the past few months with employment cuts, falling sales and profits, no ability to raise prices, and weak sales the top business problem for 1 in 5 employers. In particular, spending on services (70 percent of consumption) is very sluggish, up 0.5% year over year and declining at a 1.5% annual rate in July. This is where jobs are generated. Disposable income is up only 0.8% year over year, so no support for spending there. The savings rate is very low again therefore not much room to support more spending with less saving. Durable goods spending has posted strong growth, but this are doesn’t produce many new jobs.
Business Optimism and Consumer Confidence
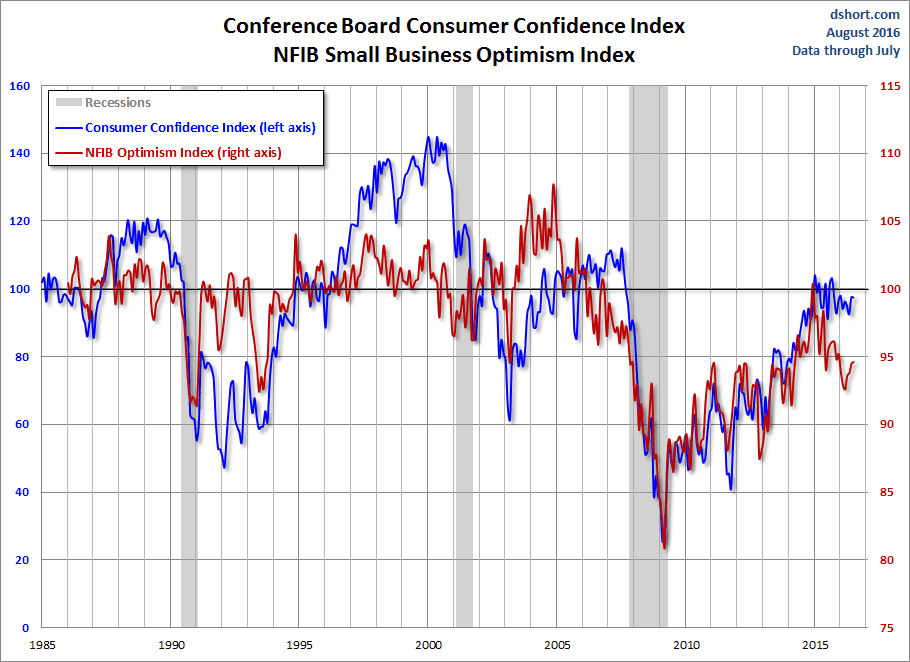
The next chart is an overlay of the Business Optimism Index and the Conference Board Consumer Confidence Index. The consumer measure is the more volatile of the two, so I've plotted it on a separate axis to give a better comparison of the volatility from the common baseline of 100. 
These two measures of mood have been highly correlated since the early days of the Great Recession, although we see a bit of contrast in the latest readings of the two. Consumer Confidence has generally been trending higher since its post-recession trough in 2011, but Small Business keeps bumping a ceiling just above its current level.
- English (UK)
- English (India)
- English (Canada)
- English (Australia)
- English (South Africa)
- English (Philippines)
- English (Nigeria)
- Deutsch
- Español (España)
- Español (México)
- Français
- Italiano
- Nederlands
- Português (Portugal)
- Polski
- Português (Brasil)
- Русский
- Türkçe
- العربية
- Ελληνικά
- Svenska
- Suomi
- עברית
- 日本語
- 한국어
- 简体中文
- 繁體中文
- Bahasa Indonesia
- Bahasa Melayu
- ไทย
- Tiếng Việt
- हिंदी
Small Business Sentiment
Latest comments
Loading next article…
Install Our App
Risk Disclosure: Trading in financial instruments and/or cryptocurrencies involves high risks including the risk of losing some, or all, of your investment amount, and may not be suitable for all investors. Prices of cryptocurrencies are extremely volatile and may be affected by external factors such as financial, regulatory or political events. Trading on margin increases the financial risks.
Before deciding to trade in financial instrument or cryptocurrencies you should be fully informed of the risks and costs associated with trading the financial markets, carefully consider your investment objectives, level of experience, and risk appetite, and seek professional advice where needed.
Fusion Media would like to remind you that the data contained in this website is not necessarily real-time nor accurate. The data and prices on the website are not necessarily provided by any market or exchange, but may be provided by market makers, and so prices may not be accurate and may differ from the actual price at any given market, meaning prices are indicative and not appropriate for trading purposes. Fusion Media and any provider of the data contained in this website will not accept liability for any loss or damage as a result of your trading, or your reliance on the information contained within this website.
It is prohibited to use, store, reproduce, display, modify, transmit or distribute the data contained in this website without the explicit prior written permission of Fusion Media and/or the data provider. All intellectual property rights are reserved by the providers and/or the exchange providing the data contained in this website.
Fusion Media may be compensated by the advertisers that appear on the website, based on your interaction with the advertisements or advertisers.
© 2007-2025 - Fusion Media Limited. All Rights Reserved.
