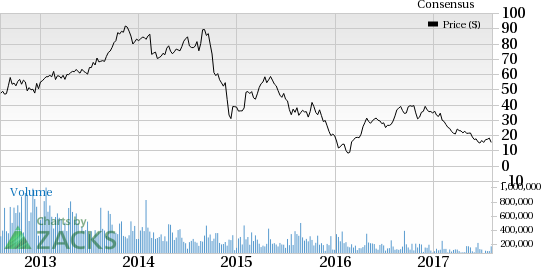
Independent oil and gas firm, SM Energy Company’s (NYSE:SM) , second-quarter 2017 adjusted earnings of 32 cents per share were in line with the Zacks Consensus Estimate. Meanwhile, the figure improved from the year-ago comparable quarter loss of 44 cents.
Total revenue decreased 64.7% to $120.7 million from $341.8 million in the prior-year quarter.
Significantly low operating expenses were partially offset by lower oil and gas equivalent realized prices as well as lower production.
Operational Performance
The company’s second-quarter production was at 124.6 thousand barrels of oil equivalent per day (MBoe/d), down 21% from the year-ago level of 157.2 MMBoe/d. The decrease is mainly attributed to the divestment of producing properties.
SM Energy produced 374.1 million cubic feet per day (MMcf/d) of natural gas in the quarter, down 13% year over year. Oil production decreased 29% year over year to 32 thousand barrels per day (MBbls/d). Natural gas liquids contributed 30.3 MBbls/d to the total volume, down 26% from the second-quarter 2016.
Due to hedging, the average equivalent price per barrel of oil equivalent (Boe) was $26.57 compared with $27.45 in the year-ago quarter. Including hedging activities, average realized price of natural gas increased 40% year over year to $3.63 per thousand cubic feet (Mcf). Average realized prices of oil fell 24% to $43.36 per barrel, whereas average realized prices of natural gas liquid grew 20% to $18.73 per barrel.
On the cost front, unit lease operating expenses (LOE) increased 24% year over year to $4.11 per Boe. Transportation expenses decreased to $5.71 per Boe from $5.95 per Boe in the year-ago period. General and administrative expenses rose 38% to $2.21 per Boe from the prior-year level of $1.60. Depletion, depreciation and amortization (DD&A) expenses were down 8% to $13.52 per Boe from the year-ago level of $14.75.
Liquidity
Net cash from operating activities decreased to $107.1 million during the quarter from $138.6 million in the year-ago quarter. As of Jun 30, SM Energy had a cash balance of $559.5 million and long-term debt of $2,901.948 million. The company had a debt-to-capitalization ratio of 53.7% compared with 52.6% in the preceding quarter.
Operating Expenses
Operating expenses amounted to $268.4 million in the second quarter as against $572.4 million in the year-ago quarter, down over 53%. Exploration expenses declined to $13.1 million from $13.2 million in the year-ago quarter.
Q2 Price Performance
The company has underperformed the industry during the second quarter, losing 31.2% compared to the industry's 15.1% decline.
Guidance
SM Energy has raised its 2017 production estimate to 44.5-46.5 MMBoe from the earlier range of 41.5–44.5 MMBoe. Production for the third quarter is projected between 10.8–11.2 MMBoe. The company has maintained its 2017 capital expenditure budget at $875 million.
Zacks Rank
SM Energy currently carries a Zacks Rank #3 (Hold). Some better-ranked stocks in the same space include Global Partners LP (NYSE:GLP) , Braskem S.A. (NYSE:BAK) and TransCanada Corp. (TO:TRP) . All of these stocks sport a Zacks Rank #1 (Strong Buy). You can see the complete list of today’s Zacks #1 Rank stocks here.
Global Partners delivered a positive earnings surprise of 1200.00% in the preceding quarter. The company beat estimates in three of the trailing four quarters with an average positive earnings surprise of 415.30%.
Braskem delivered a positive earnings surprise of 107.79% in the quarter ending September 2016.
TransCanada delivered a positive earnings surprise of 12.00% in the preceding quarter. It surpassed estimates in two of the trailing four quarters with an average positive earnings surprise of 4.06%.
"5 Trades Could Profit ""Big-League"" from Trump Policies
If the stocks above spark your interest, wait until you look into companies primed to make substantial gains from Washington's changing course.
Today Zacks reveals 5 tickers that could benefit from new trends like streamlined drug approvals, tariffs, lower taxes, higher interest rates, and spending surges in defense and infrastructure. See these buy recommendations now >>
Global Partners LP (GLP): Free Stock Analysis Report
Braskem S.A. (BAK): Free Stock Analysis Report
TransCanada Corporation (TRP): Free Stock Analysis Report
SM Energy Company (SM): Free Stock Analysis Report
Original post
Zacks Investment Research

