Let’s take an in-day snapshot of gold vs. several key competitors (for your investment dollars/euros/yen, etc.) and check the progress in turning the macro from risk ‘on’ to risk ‘off’, cyclical to counter-cyclical.
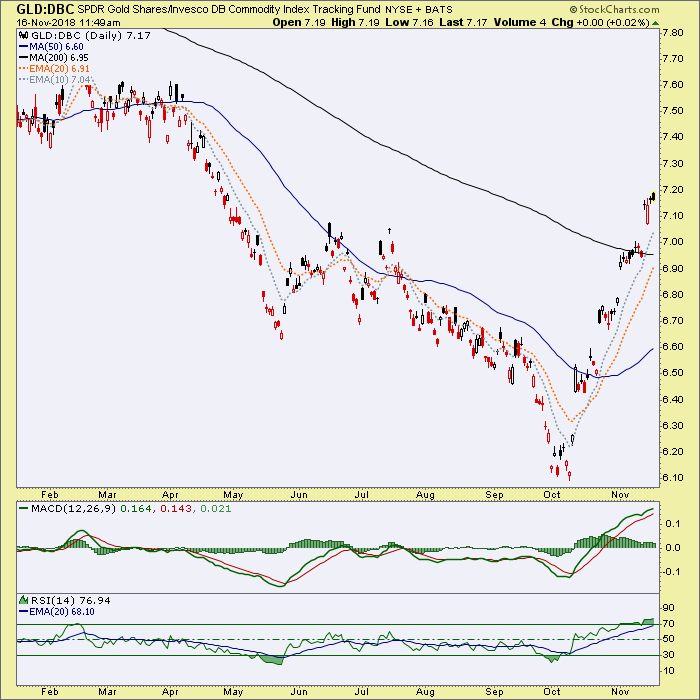
Gold/Commodities motors along above the SMA 200. The move has been hysterical, and thus looks impulsive. That could mean something as we look back in hindsight one day.
Gold/Oilhas been the driver of the above.
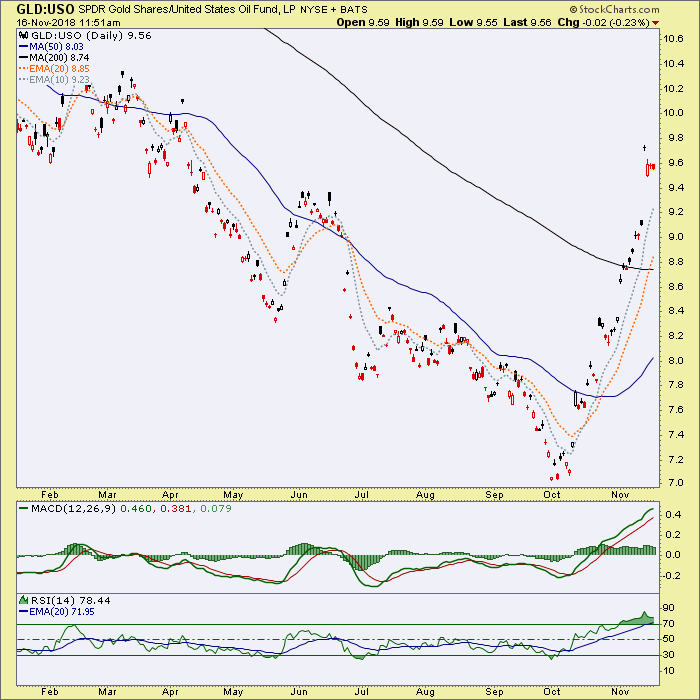
Gold vs. Commodities is a cyclical macro fundamental indicator but vs. mining cost inputs like oil, it is also a gold miner sector fundamental consideration.
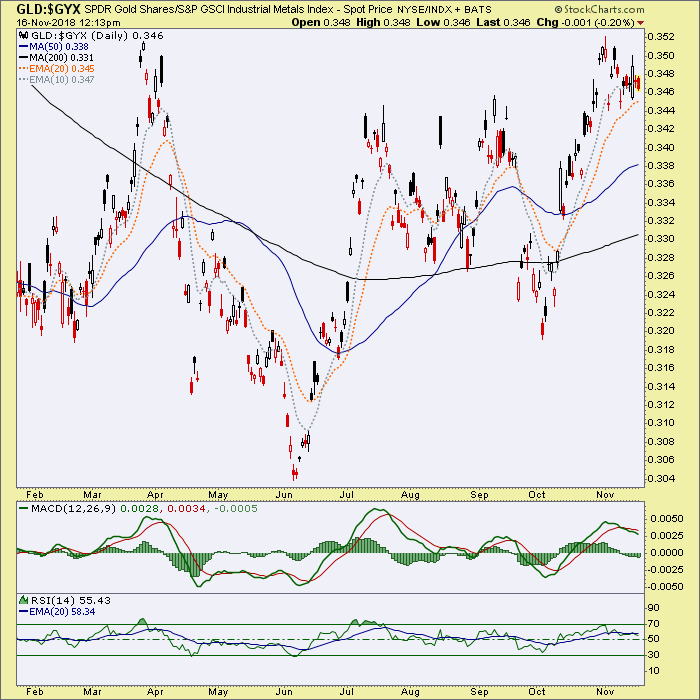
Gold vs. Industrial Metals is a classic counter-cyclical vs. cyclical metal situation. Thus it is a key macro consideration. GLD/GYX is consolidating a big upturn and appears biased bullish now (which would be a negative for risk ‘on’ cyclical trades).
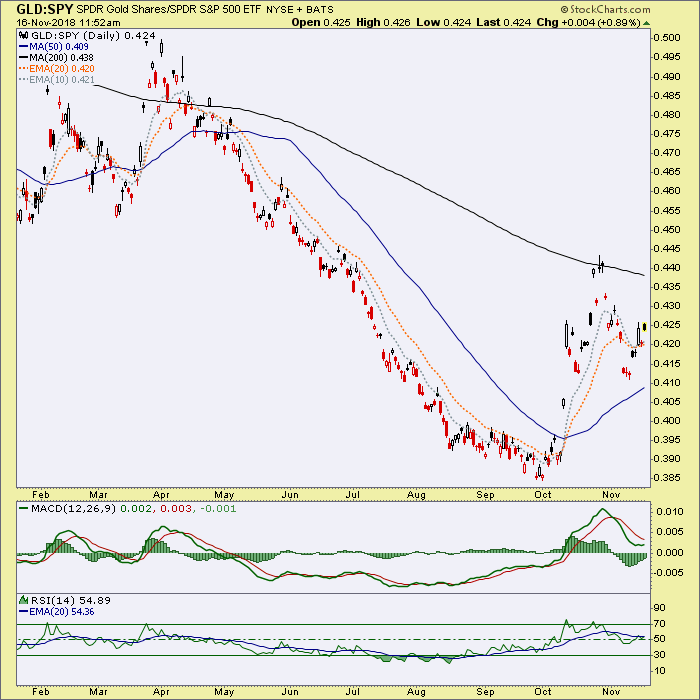
Gold/US Stocks (a cyclical macro fundamental) has turned up again this week. We used a daily chart of gold vs. major stock markets last weekend to show that the pullback had only been a test of the SMA 50 thus far.
Gold/Global Stocks looks pretty good after its pullback.
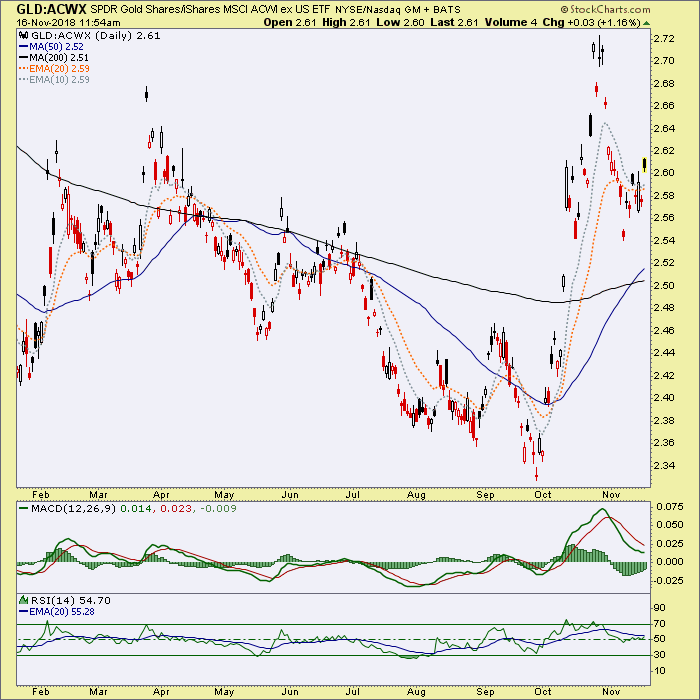
While I continue to be open to (and positioned for) a stock market bounce on the short-term, the longer-term picture is easing toward counter-cyclical, risk ‘off’ and thus, a favorable forward view for the gold sector.
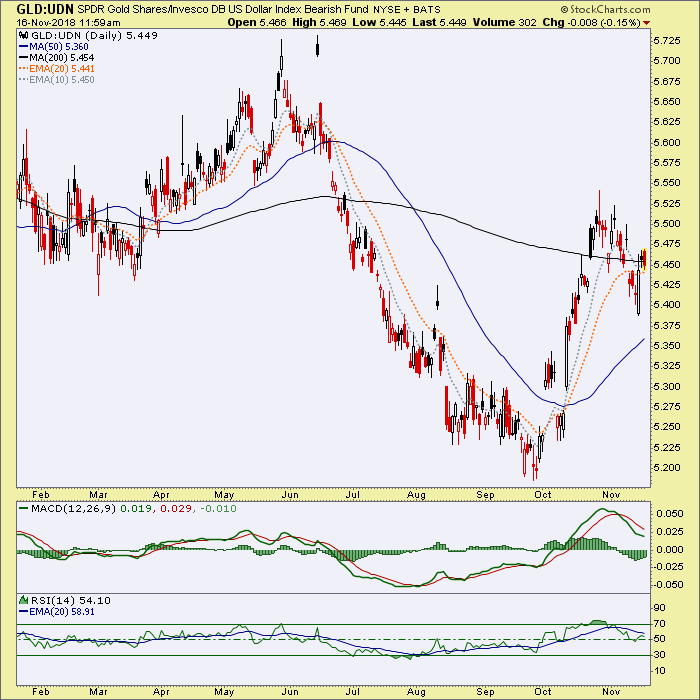
Gold/Global Currencies (a proxy being the PowerShares DB US Dollar Bearish Fund (NYSE:UDN)) had also pulled back after a big up surge. We’ve been tracking this for months, and while not shown here a weekly chart view would show that Gold/UDN turned up right at a longer-term trend channel’s lower bound at the September low. That was a very key hold for gold as we noted in real time.
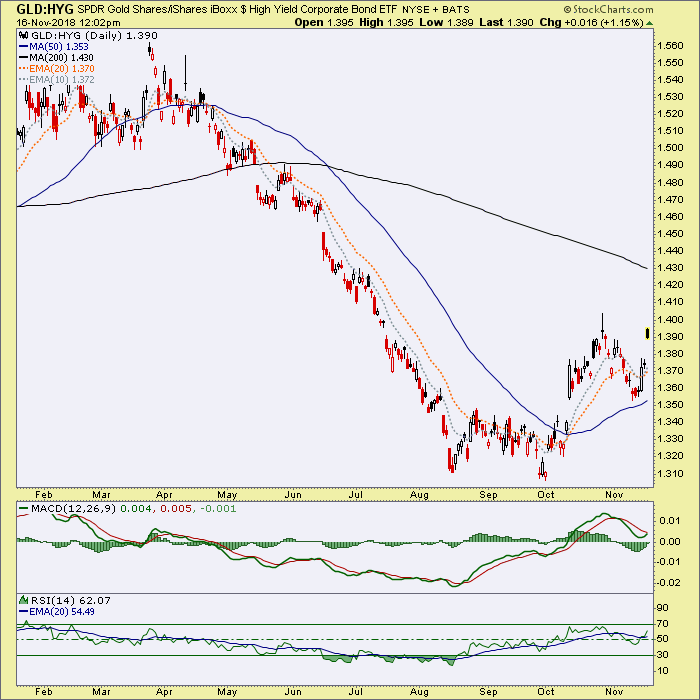
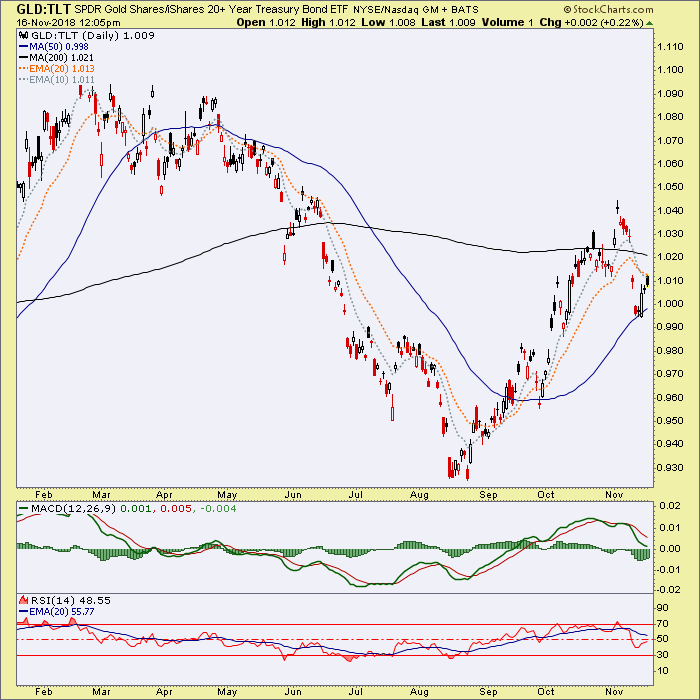
Gold/Bonds can be viewed in 2 flavors, vs. Junk and vs. Treasurys.
Junk bonds had flown ever higher with the various risk ‘on’ trades but have come under pressure with the recent stock market troubles. Importantly, gold looks very constructive (though still in a long-term downtrend, as it is vs. most asset markets) vs. Junk bonds. As we’ve been saying, changes would have to start somewhere and that somewhere would be a daily chart like this.
Gold vs. Long-term Treasury is more suspect, but don’t forget that Treasury bonds are the traditional risk ‘off’ vehicle. Treasuries and the US dollar tend to get the liquidity bid before gold does. Now add in a contrary bullish sentiment setup in bonds (the world is leaning bearish bonds) and I am not going to sweat this ratio too much as a gold bug.
Just a little stroll down macro indicator lane. Slowly we turn, step by step, inch by inch… And for good measure, a reminder about the Macrocosm of what will be important for the gold sector moving forward.

