To get the economy back on track, President Trump has outlined a bold plan to create 25 million new American jobs in the next decade and return to 4 percent annual economic growth
Follow up:
Elected officials have a very shallow and misguided views of economic gearing. I have no problem with people setting goals pushing the limits of what MAY be possible. However, USA economic growth of 4% year-over-year is likely impossible without massive deficit spending. Economic dynamics are simply not there for the consumer segment of the economy to expand spending.
Life Cycle Spending
The life-cycle hypothesis says consumers save during earning years and dis-save when they retire. The logic of this hypothesis implies that retirees spend at the same rate as they did when they were working. This ain't true. Good posts on this subject were published by the Richmond Fed. [here][here] One assertion:
Consumption may be lower for young people than the model predicts if they are credit constrained. They may wish to borrow against expected higher future earnings but can do so only if lenders extend the credit to them. Uncertainty may play a role as well. Since young individuals don't know exactly what their future earnings potential will be, they may hesitate to accumulate a lot of debt for fear that they won't be able to pay it off.
Uncertainty plays a role at the end of life as well. Since individuals do not know exactly how long they will live, it is hard for them to smoothly draw down their wealth throughout retirement. Retirees may also save more than predicted because they wish to leave some of their wealth to their descendants. Finally, the drop in consumption at the end of the life cycle could be due to "hyperbolic discounting." Behavioral economists have advanced the idea that individuals have trouble planning for the future, which leads them to save too little to maintain their level of consumption after retirement.
No question millennials are saddled with significantly more education debt not faced by previous generations. There are now more than 75 million millennials which now make it a larger demographic group than the boomers. Because our politicians have shifted the bulk of costs of university education to the students, millennials are now carrying $1.4T of student loans. Roughly this pulls $100 billion of spending from this group annually which is now used for student loan repayment. Just the effect of student loans are a 0.5% headwind on GDP.
Being a boomer, I get a front row seat to retirement issues. I have friends who thought they were going to get a pension after retirement. Most are getting less than expected due to cutbacks. The corporation I worked for never had pensions but actually a really good 401(k). I got to ride the markets where investing was brainless as it was real hard to lose. But just in time for many boomers retirement - there was the great market crash of 2008. Many thought their 401(k) or IRA was the engine for retirement income - the reality is that the retirement accounts themselves became part of retirement income. From my perspective, the majority of boomers are tapped out - with little or no ability to increase sending [and most likely are figuring out ways to shrink spending].
Saving or Lack Thereof
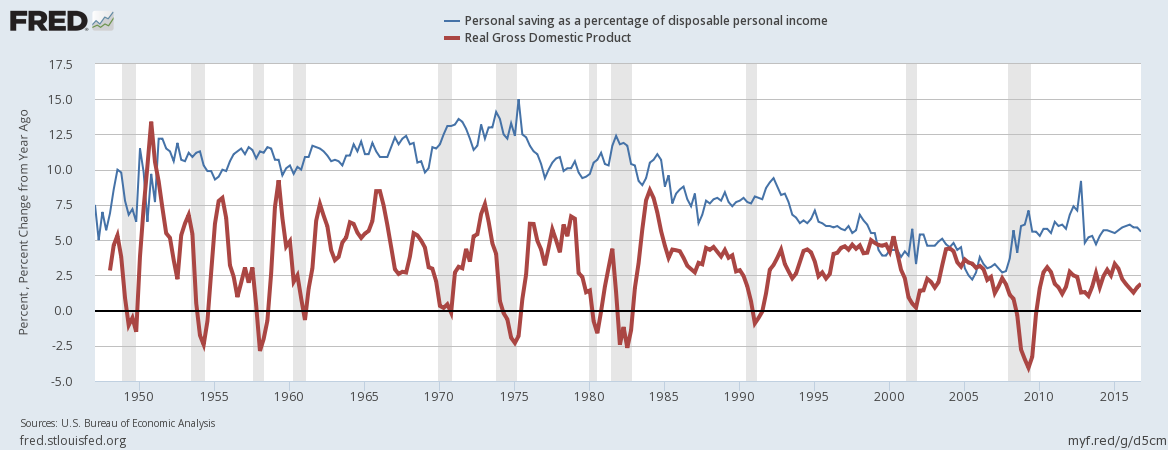
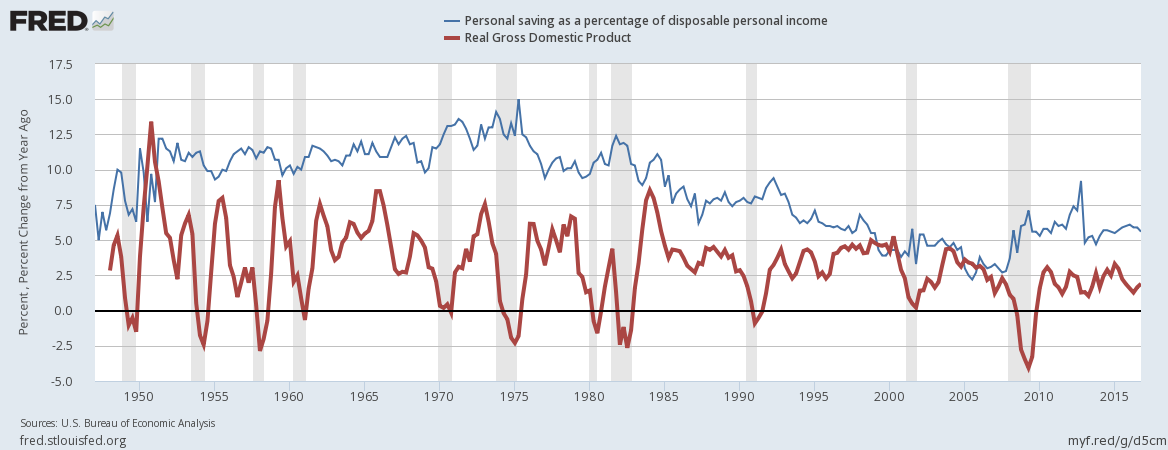
An even larger drag on the potential of ever seeing 4% growth comes from a historically low savings rate. Consider that consumers can only spend more if they make more money, borrow money, or save less. Median incomes have been stagnant for the last 17 years, and the saving rate is at the lowest level seen in the last 70 years. As far as borrowing money, where does the money come from to pay back the loan (if there is no additional income or little savings)?
- Before 2000, it was not uncommon to see 5% GDP growth. Since 2010, the USA was lucky to see 2.5% growth.
- Before 1980, consumers were saving over 10% of their income. Since 2000, savings have been averaging 5%.

Yet, the consumer portion of the economy has been growing (also meaning the business portion of the economy is contracting). The graph below plots disposable personal income portion of GDP. [note that consumer income and expenditures have historically grown at the same rate].

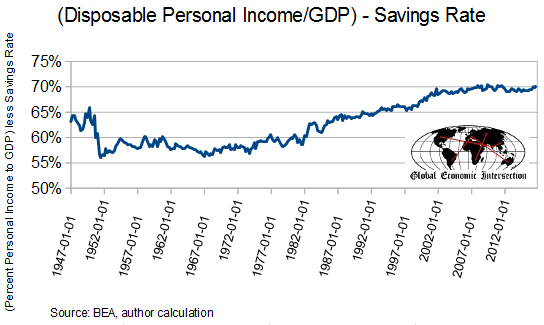
Note in the above graphic that there is significant variation from period to period. Most of this variation comes from changes in the savings rate from period to period. The graph below removes savings from disposable income.

Note since 2000 that the consumer segment of the economy stopped growing - but between 1967 and 2000, the consumer was the growth engine for the economy. To get to 4% economic growth - one would need to get more money into the hands of the consumer.
How Can the USA More Than Double the Rate of Growth?
----[fill in the blank]. The real question is NOT whether the USA really needs to see 4% growth, but how to improve the quality of life for the median American.
Other Economic News this Week:
The Econintersect Economic Index for March 2017 improvement trend continues although the value remains in the territory of weak growth. The index remains below the median levels seen since the end of the Great Recession. The data continues to suggest better dynamics in the future. Six-month employment growth forecast indicates modest improvement in the rate of growth.
Bankruptcies this Week from bankruptcydata.com: Square (NYSE:SQ) Two Financial, Ezra Holdings Ltd (SI:EZRA), Electronic Cigarettes International Group (a/k/a Victory Electronic Cigarettes and Teckmine Industries - Chapter 7), Ulaanbaatar, Mongolia-based Mongolian Mining (Chapter 15), P10 Industries
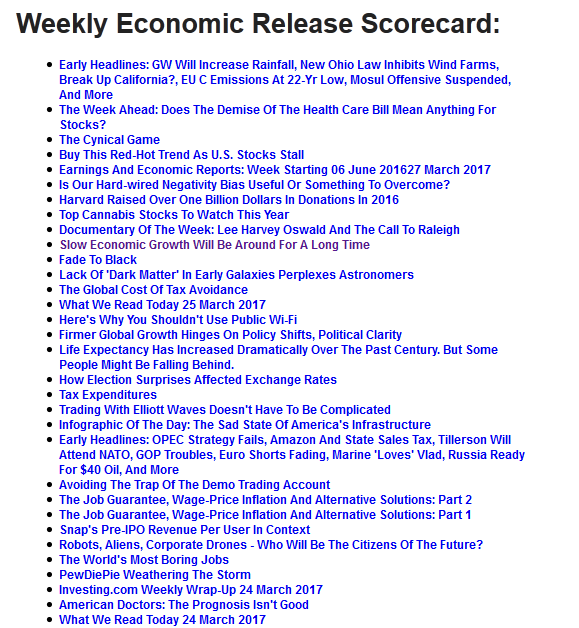
Click here to view the scorecard table below with active hyperlinks
Weekly Economic Release Scorecard:

