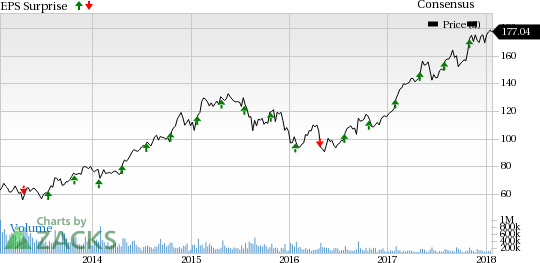
SL Green Realty Corp. (NYSE:SLG) reported fourth-quarter 2017 adjusted funds from operations (“FFO”) of $1.60 per share, in line with the Zacks Consensus Estimate. However, the figure was above the prior-year quarter’s adjusted FFO per share of $1.43.
The company witnessed a decline in quarterly revenues, which fell 3.4% year over year to $361.3 million. However, it handily surpassed the consensus estimate of $286.9 million.
For full-year 2017, the company reported adjusted FFO per share of $6.45, which too came in line with the Zacks Consensus Estimate, but was down from $8.29, reported a year ago. Revenues for full-year 2017 declined 18.9% year over year to around $1.5 billion. Nonetheless, it beat the consensus estimate of $1.1 billion.
Quarter in Detail
For the quarter, same-store cash net operating income (NOI), including the share of same-store cash NOI from unconsolidated joint ventures, inched up 1.1% from the prior-year quarter. Notably, consolidated property same-store cash NOI increased 0.1%.
In the Manhattan portfolio, SL Green signed 47 office leases for 358,135 square feet of space, during the quarter. As of Dec 31, 2017, Manhattan same-store occupancy, inclusive of leases signed but not yet commenced, was 95.3%, up 50 basis points (bps) from the end of the prior quarter. Importantly, in the fourth quarter, the mark-to-market on signed Manhattan office leases was 12.1% higher, over the previous fully-escalated rents on the same spaces.
On the other hand, in the Suburban portfolio, SL Green signed 22 office lease deals for 116,212 square feet of space. Same-store occupancy for the Suburban portfolio, inclusive of leases signed, but not yet commenced, was 87.2%, as of Dec 31, 2017, up 60 bps from the end of the prior quarter. Moreover, in the quarter under review, mark-to-market on signed suburban office leases was 3.7% lower than the previously fully-escalated rents on the same spaces.
Liquidity
SL Green exited the quarter with cash and cash equivalents of nearly $127.9 million, down from $279.4 million recorded at the end of 2016.
Investment Activity
During the fourth quarter, SL Green repurchased 4.9 million shares of common stock and also made the announcement that the board of directors had authorized another $500 million share repurchase plan, and increased the size of the repurchase plan to $1.5 billion shares. The shares were bought back at an average price of $100.76 per share.
In October, the company completed the earlier announced sale of 125 Chubb (NYSE:CB) Avenue in Lyndhurst for a gross asset valuation of $29.5 million. This transaction generated net proceeds of $28.7 million.
Further, in November, the company closed the sale of 30% stake in 1515 Broadway for a gross sales price of $1.95 billion. The balance transaction is scheduled to close in 1Q18. Both transactions, in total, are likely to generate net proceeds of $433.8 million.
Additionally, the company originated new debt and preferred equity investments, aggregating $447.8 million in the quarter, of which $252.2 million was retained at a yield of 7.5%.
Our Take
SL Green enjoys high-quality office properties as well as diverse tenant base, makes opportunistic investments and has a strong balance sheet. Additionally, its leasing activity is likely to remain decent, amid an improving economy and job market environment. However, the company faces intense competition from developers, owners and operators of office properties, and other commercial real estate which limits its pricing power.
SL Green Realty Corporation Price, Consensus and EPS Surprise
SL Green currently carries a Zacks Rank #3 (Hold). You can see the complete list of today’s Zacks #1 Rank (Strong Buy) stocks here.
Stocks That Warrant a Look
Here are a few stocks in the REIT sector that you may want to consider, as our model shows that they have the right combination of elements to report a positive surprise this quarter:
Alexandria Real Estate Equities (NYSE:ARE) , scheduled to release earnings on Jan 29, has an Earnings ESP of +0.33% and a Zacks Rank #3.
CubeSmart (NYSE:CUBE) , slated to release fourth-quarter results on Feb 15, has an Earnings ESP of +1.10% and a Zacks Rank #3.
Diamondrock Hospitality Company (NYSE:DRH) , scheduled to report quarterly numbers on Feb 28, has an Earnings ESP of +4.76% and a Zacks Rank #3.
Note: Anything related to earnings presented in this write-up represent funds from operations (FFO) — a widely used metric to gauge the performance of REITs.
Today's Stocks from Zacks' Hottest Strategies
It's hard to believe, even for us at Zacks. But while the market gained +18.8% from 2016 - Q1 2017, our top stock-picking screens have returned +157.0%, +128.0%, +97.8%, +94.7%, and +90.2% respectively.
And this outperformance has not just been a recent phenomenon. Over the years it has been remarkably consistent. From 2000 - Q1 2017, the composite yearly average gain for these strategies has beaten the market more than 11X over. Maybe even more remarkable is the fact that we're willing to share their latest stocks with you without cost or obligation.
SL Green Realty Corporation (SLG): Free Stock Analysis Report
CubeSmart (CUBE): Free Stock Analysis Report
Alexandria Real Estate Equities, Inc. (ARE): Free Stock Analysis Report
Diamondrock Hospitality Company (DRH): Free Stock Analysis Report
Original post

