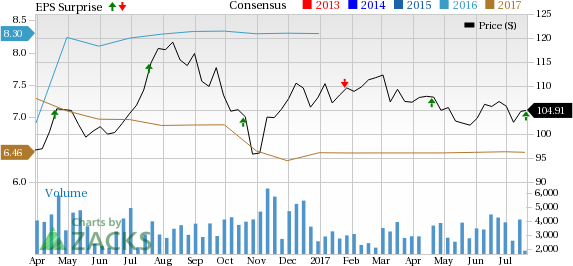
SL Green Realty Corp. (NYSE:SLG) reported second-quarter 2017 funds from operations (“FFO”) of $1.78 per share, ahead of the Zacks Consensus Estimate of $1.62. The figure came in lower than the prior-year quarter’s FFO per share of $3.39.
Notably, second-quarter 2017 FFO per share figure included 9 cents per share of prior unrecognized income on the company's preferred equity investment in 885 Third Avenue as well as 10 cents per share of net fees associated with the closure of the One Vanderbilt joint venture. On the other hand, the year-ago quarter FFO per share number included $1.77 per share of income related to 388-390 Greenwich Street that was sold in that very quarter.
However, rental revenues of $279.4 million in the reported quarter missed the Zacks Consensus Estimate of $281.4 million. In addition, the figure plunged 33.0% on a year-over-year basis.
Quarter in Detail
For the quarter, same-store cash net operating income (NOI), including the share of same-store cash NOI from unconsolidated joint ventures, edged down 0.5% year over year. Notably, consolidated property same-store cash NOI descended 2.0%. Results reflect the impact of expected tenant move-outs at some of its properties. However, the company reaffirmed its full-year 2017 same store cash NOI guidance range of 2.0–3.0%.
In the Manhattan portfolio, SL Green inked 45 office leases for 314,399 square feet of space. As of Jun 30, 2017, Manhattan same-store occupancy, inclusive of leases signed but not yet commenced, was 94.9%, down 80 basis points from the end of the prior quarter. Importantly, in the second quarter, the mark-to-market on signed Manhattan office leases was 13.2% higher over the previous fully escalated rents on the same spaces.
On the other hand, in the Suburban portfolio, SL Green signed 21 office lease deals for 159,581 square feet of space. Same-store occupancy for the Suburban portfolio, inclusive of leases signed but not yet commenced, was 85.1% as of Jun 30, 2017, up 50 bps from the end of the prior quarter. Moreover, in the quarter under review, mark-to-market on signed Suburban office leases was 7.1% higher than the previously fully escalated rents on the same spaces.
SL Green exited the quarter with cash and cash equivalents of nearly $271.0 million, down from $279.4 million at the end of 2016.
During the second quarter, SL Green repurchased 2.4 million shares of common stock under its previously announced $1.0 billion share repurchase plan. The shares were bought back at an average price of $103.41 per share.
Additionally, the company originated new debt and preferred equity investments aggregating $431.0 million in the reported quarter, of which $369.8 million was retained at a yield of 10.2%.
Our Take
The decline in quarterly revenues from the previous year is discouraging. Nevertheless, SL Green has high-quality office properties and diverse tenant base, as well as pursues portfolio enhancement initiatives through investment in opportunistic assets, and debt and preferred equities. However, cut-throat competition and interest rate issues remain concerns.
SL Green currently carries a Zacks Rank #3 (Hold). You can see the complete list of today’s Zacks #1 Rank (Strong Buy) stocks here.
We now look forward to the earnings releases of other REITs like Equity Residential (NYSE:EQR) , Liberty Property Trust (NYSE:LPT) and PS Business Parks, Inc. (NYSE:PSB) . All of them have their earnings releases scheduled for Jul 25.
Note: All EPS numbers presented in this write up represent funds from operations (“FFO”) per share. FFO, a widely used metric to gauge the performance of REITs, is obtained after adding depreciation and amortization and other non-cash expenses to net income.
3 Top Picks to Ride the Hottest Tech Trend
Zacks just released a Special Report to guide you through a space that has already begun to transform our entire economy...
Last year, it was generating $8 billion in global revenues. By 2020, it's predicted to blast through the roof to $47 billion. Famed investor Mark Cuban says it will produce "the world's first trillionaires," but that should still leave plenty of money for those who make the right trades early. Download Report with 3 Top Tech Stocks >>
Equity Residential (EQR): Free Stock Analysis Report
PS Business Parks, Inc. (PSB): Free Stock Analysis Report
SL Green Realty Corporation (SLG): Free Stock Analysis Report
Liberty Property Trust (LPT): Free Stock Analysis Report
Original post
Zacks Investment Research

