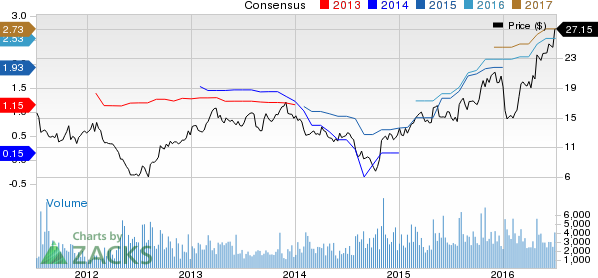
Shares of SkyWest Inc. (NASDAQ:SKYW) , which operates a regional airline in the U.S. through its subsidiaries SkyWest Airlines and ExpressJet Airlines, hit a 52-week high of $27.17 on Jul 1, before closing the trading session a tad bit lower at $27.15. We are impressed by the St. George, UT-based carrier’s efforts to streamline its operations.
Earnings History
The carrier has a remarkable track record with respect to earnings beats, having outshined the Zacks Consensus Estimate in each of the last four quarters, at an average of 63.22%. As is the case with other carriers, SkyWest’s results are benefitting from low oil prices. In the first quarter of 2016, average fuel price per gallon was $1.53, much lower than the year-ago figure of $2.16. We expect the regional carrier’s second-quarter results to be aided by low fuel costs.
We also applaud the carrier’s decision to modernize its fleet by adding new aircraft and getting rid of unprofitable/less profitable ones. The company aims to take delivery of 26 E175s by Dec 31, 2016, apart from 22 similar planes in 1H17. Following the completion of the deliveries, the regional carrier’s fleet size will boast 104 E175s.
Dividend Account
The regional carrier has an impressive history with respect to dividend payments as well. The carrier has paid dividends for 83 consecutive quarters. The 84th dividend payout to be paid on Jul 7 will mark a 25% increase over the previous payout of $0.04 per share.
The dividend hike not only highlights SkyWest’s commitment to consistently reward shareholders but also underlines the carrier’s healthy financial condition and business strength.
Valuation
On a price-to-book basis, shares are trading at 0.88x, which indicates that the stock is undervalued as it is less than 1. Moreover, on a price-to-sales basis, shares are trading at 0.46x, a significant discount to the industry average of 0.58x. Moreover, SkyWest currently trades at a forward P/E of 10.72x.
Moreover, earnings per share estimates at SkyWest have increased 17.7% and 12.8% over the last 90 days to $2.53 and $2.73 for 2016 and 2017, respectively.
Zacks Rank & Key Picks
SkyWest currently carries a Zacks Rank #3 (Hold). Better-ranked stocks in the airline space include Cathay Pacific Airways Ltd. (OTC:CPCAY) , GOL Linhas Aereas Inteligentes S.A. (NYSE:GOL) and ANA Holdings Inc. (OTC:ALNPY) . While ANA Holdings carries a Zacks Rank #2 (Buy), GOL Linhas and Cathay Pacific sport a Zacks Rank #1 (Strong Buy).
GOL LINHAS-ADR (GOL): Free Stock Analysis Report
CATHAY PAC AIR (CPCAY): Free Stock Analysis Report
SKYWEST INC (SKYW): Free Stock Analysis Report
ANA HOLDINGS (ALNPY): Free Stock Analysis Report
Original post
Zacks Investment Research

