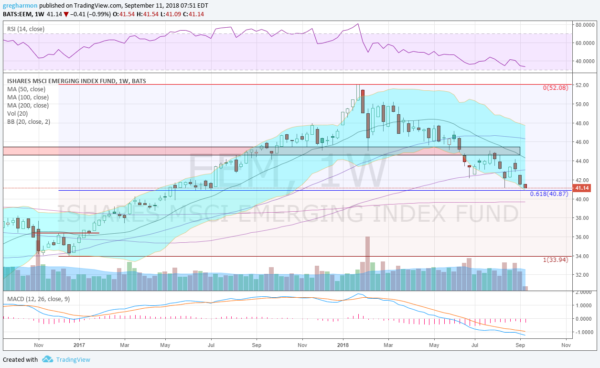
After a long run to the upside through 2017, Emerging Markets) have been shedding value ever since the beginning of of the year.

The drop is now closing in on a 61.8% retracement of the move higher. This happens to also have been a support level as they were heading higher in May of 2017. Will they stop sinking? This would be a good spot for a reversal. But the chart looks more like the geological path will continue. The flood waters will continue to rise. The momentum indicators show no signs of letting up.
The RSI is falling in the bearish zone with the MACD continuing lower. And the Bollinger Bands® are in a clear downward channel. The next interesting price level comes at the 200 day SMA just below 40. Continuing below that could be a death knell for the Emerging Markets ETF, as the 200 day SMA marks the bear/bull border for many.
The information in this blog post represents my own opinions and does not contain a recommendation for any particular security or investment. I or my affiliates may hold positions or other interests in securities mentioned in the Blog, please see my Disclaimer page for my full disclaimer.
