- 16 of 43 single country ETFs are in ongoing uptrends or recent reversals from downtrends
- 12 of 16 have composite valuation levels lower than total US stocks
- 8 of 12 produced positive earnings growth in the past 3 years and is forecasted for 1-year forward positive growth
- 3 of 8 have higher trailing yields than total US stocks
Those three single country funds are for South Korea (iShares MSCI South Korea Capped (NYSE:EWY)), Taiwan (iShares MSCI Taiwan (NYSE:EWT)), and New Zealand (iShares MSCI New Zealand Capped (NYSE:ENZL)).
Here are the data for the 43 ETFs:
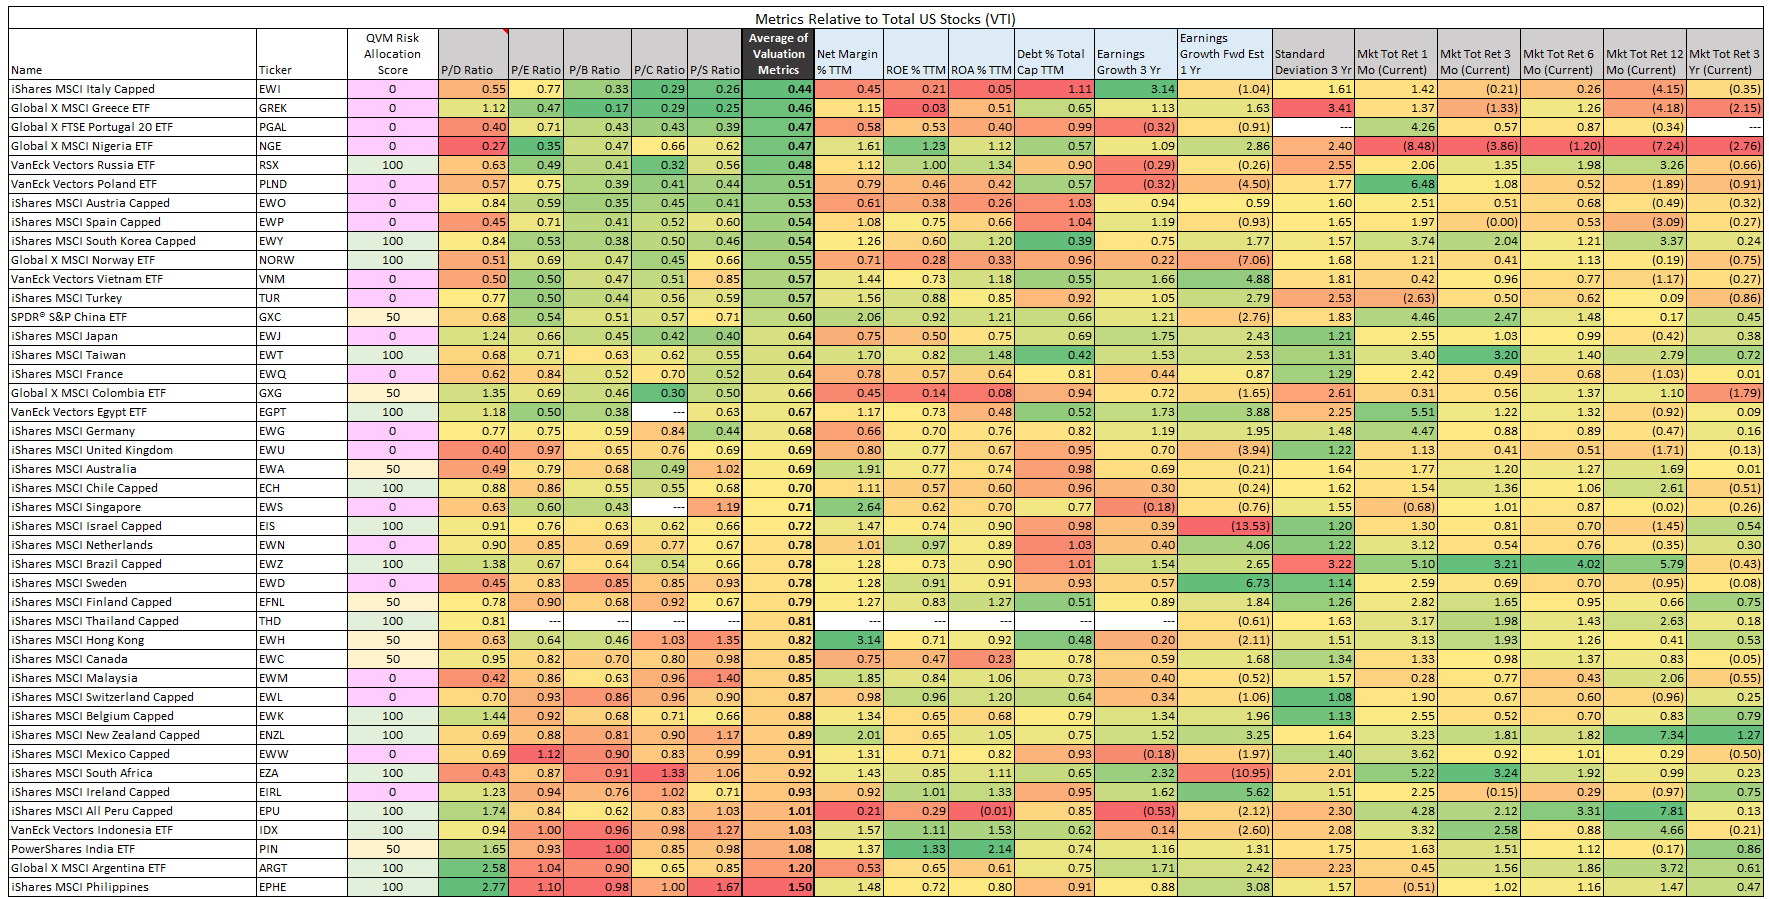
The data is sorted according to the composite valuation, which is the average of the relative valuation for Price/Dividends, Price/Earnings, Price/Book, Price/CashFlow, and Price/Sales.
Relative Valuation in this study is the valuation multiple for the ETF divided by the valuation multiple for total US stocks (as represented by VTI).
All of the other metrics are also relative calculated in the same manner.
The trend rating is based on four monthly factors:
- direction of the tip of the 10-month moving average (solid gold line in chart)
- position of the price above or below the moving average (black vertical bars in chart)
- price change vs a geometric pace - Wilder Stop and Reverse (red dotted lines in chart)
- buying or selling pressure (dashed green line in chart)
The upper panel of the chart plots the trend rating over time with rating of 100, 50 or 0.
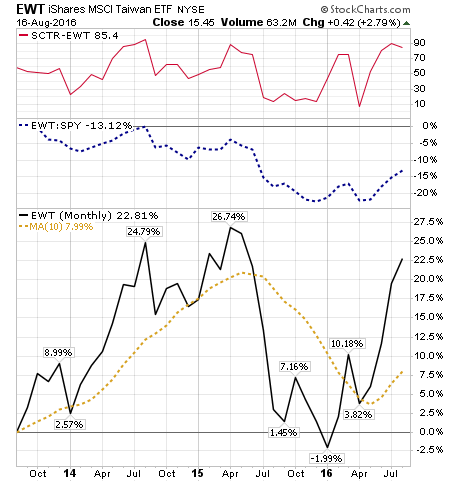
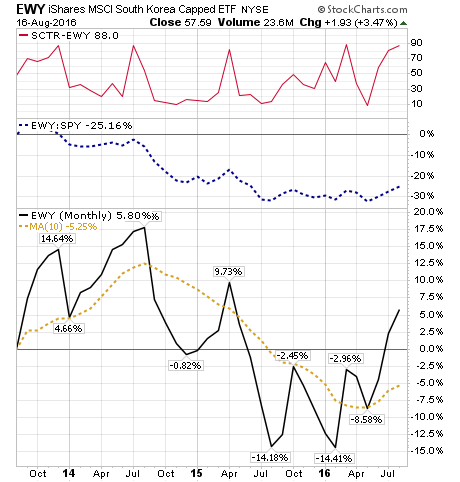
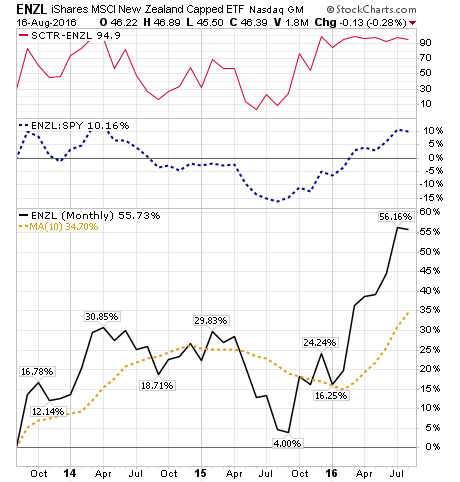
Here is chart data for the three filtered ETFs, made with Metastock and code we developed in-house:
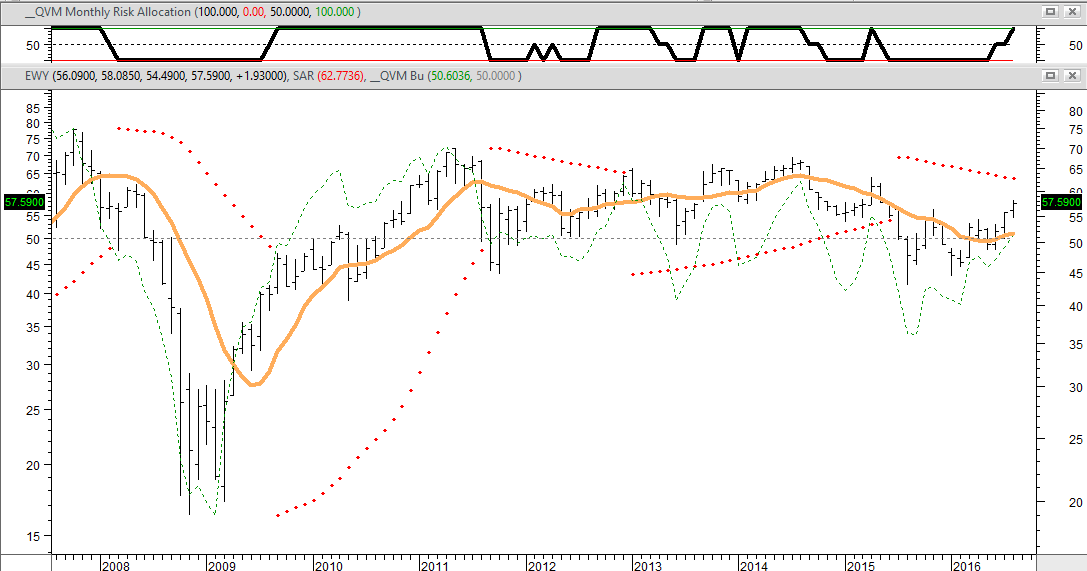
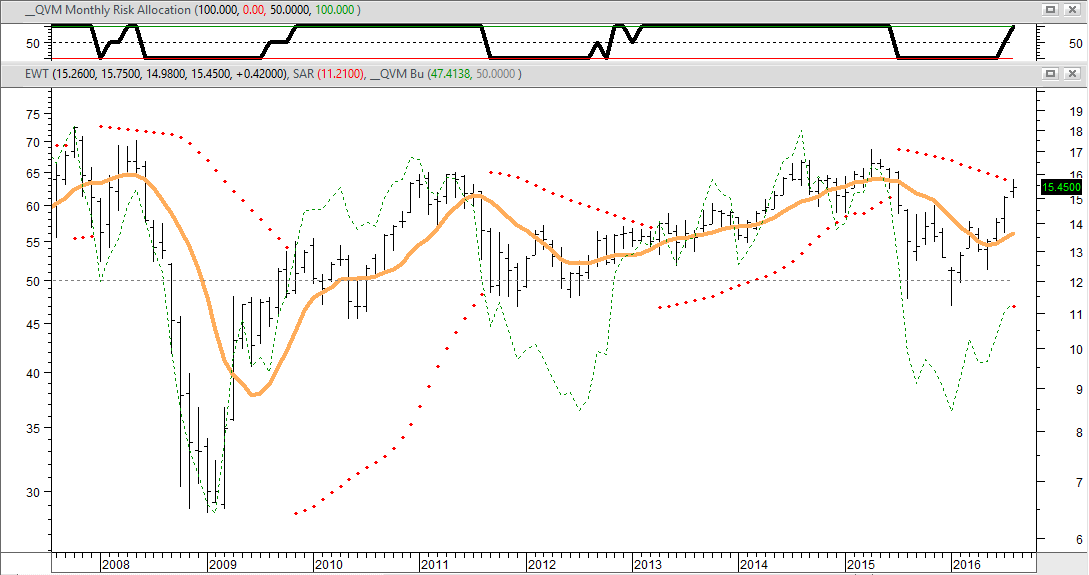
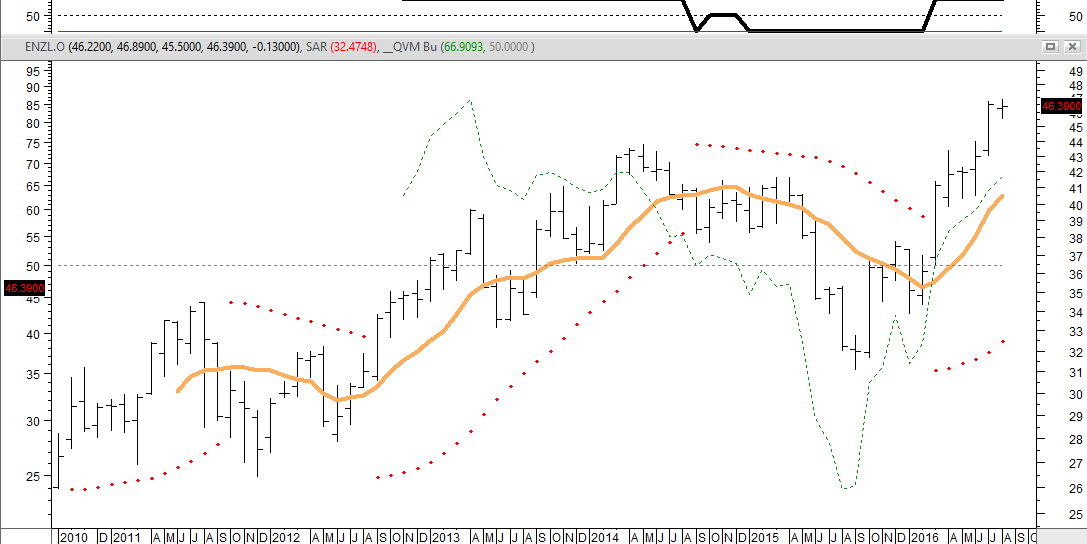
These are additional charts made with the monthly price performance, 10-month moving average, ratio of the ETF performance to SPDR S&P 500 (NYSE:SPY—the leading S&P 500 proxy), and the Stock Charts Technical Rating (“SCTR”).
The upper panel in red is the technical rating. The middle panel in blue is the performance relative to the S&P 500. The main panel shows the monthly performance and the 10-month moving average.
The South Korea and Taiwan trends are developing, and the New Zealand trend may be peaking or ready for a pause, based on the Stock Charts Technical Rating.
The three country funds have significantly different sector compositions:

South Korea and Taiwan are heavy in tech, with little or no real estate or energy. New Zealand is more balanced with highest concentrations in communications, healthcare and utilities, with no financial services and light on consumer sectors. They are all in the Asia/Pacific region.
MSCI country index returns have longer data series than some funds that track them. Here is the gross return in dollars for Korea, Taiwan and New Zealand:

