Singapore’s GDP grew 2.9% in the second quarter of 2017 on a year-over-year basis compared with a 2.5% growth in the first quarter. Moreover, on a seasonally-adjusted basis, GDP grew 2.2% sequentially in the second quarter compared with a contraction of 2.1% in the first quarter and above a Bloomberg survey estimate of 2.5%.
This led the ministry to change the GDP growth outlook for 2017. It changed the expected range to 2–3% from 1–3% predicted earlier. The GDP growth rate was 2% in 2016.
Moreover, per the Department of Statistics, Singapore’s retail sales grew 1.9% to S$3.7 billion in June from S$3.6 billion a year ago.
Being primarily a trade dependent country, a recovery in trade helped the economy gain momentum. Manufacturing sector grew 8.1% year over year in the second quarter.
Per Bloomberg, the services industry, which accounts for almost 70% of the economy, grew an annualized 3.3% in the second quarter from the previous three months. While the finance and insurance sector grew 3.8% year over year, the business services sector and other services sector were up 1.8% and 3.1% year over year, respectively.
Moreover, Singapore is witnessing an increase in business confidence, which improved for the second consecutive quarter. Per Singapore Commercial Credit Bureau (SCCB), the Business Optimism Index rose to 3.58% in the third quarter of 2017 compared with 2.66% in the prior quarter. Moreover, on a year-over-year basis, the index rose to 3.58% in the third quarter compared with 1.11% in the prior-year quarter.
However, per the International Enterprise (IE) Singapore, Singapore’s non-oil domestic exports (NODX) grew 2.7% year over year in the second quarter compared with 15.3% in the first quarter.
We will now discuss a few ETFs providing exposure to Singapore (see all the Asia Pacific ETFs here).
IShares MSCI Singapore Capped ETF (V:EWS)
This fund focuses on Singapore equities and is the most popular option for exposure to the economy.
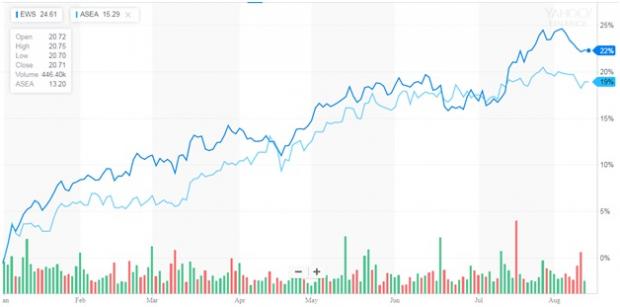
The fund has AUM of $600.13 million and charges 48 basis points in fees per year. Financials, Real Estate and Industrials are the top three sectors of the fund, with 37.72%, 20.52% and 18.30% allocation, respectively (as of August 10, 2017). DBS Group Holdings Ltd, Oversea-Chinese Banking Ltd and United Overseas Bank Ltd are the top three holdings of the fund, with 12.77%, 11.72% and 10.51% allocation, respectively (as of August 10, 2017). The fund has returned 11.90% in the last one year and 22.30% year to date (as of August 11, 2017). EWS currently has a Zacks ETF Rank 3 (Hold) with a Low risk outlook.
We will now compare the performance of EWS to a broader South East Asian ETF, ASEA.
Global X Southeast Asia ETF ASEA
This fund provides broad exposure to the five members of the Association of Southeast Asian Nations, Singapore, Indonesia, Malaysia, Thailand, and the Philippines. It is appropriate for investors looking for a diversified exposure to South East Asia (read: Indonesia's GDP Growth Misses Expectations: ETFs in Focus)
ASEA is less popular with AUM of $13.73 million and charges a fee of 65 basis points a year. From a geographical perspective, the fund has 30.45% exposure to Singapore, 22.29% to Malaysia, 21.15% to Thailand, 19.67% to Indonesia and 6.44% to Philippines (as of June 30, 2017). Financials, Telecommunication Services and Industrials are the top three sectors of the fund, with 45.92%, 14.94% and 8.12% allocation, respectively (as of June 30, 2017). DBS Group Holdings Ltd, Oversea-Chinese Banking Ltd and United Overseas Bank Ltd are the top three holdings of the fund, with 7.28%, 7.18% and 5.99% allocation, respectively (as of August 11, 2017). The fund has returned 6.92% in the last one year and 18.89% year to date (as of August 11, 2017). ASEA currently has a Zacks Rank #3 with a Medium risk outlook.
Below is a chart comparing the year-to-date performance of the two funds.

Source: Yahoo (NASDAQ:AABA) Finance
Want key ETF info delivered straight to your inbox?
Zacks’ free Fund Newsletter will brief you on top news and analysis, as well as top-performing ETFs, each week. Get it free >>
ISHRS-MS SNGPRE (EWS): ETF Research Reports
GLBL-X SE ASIA (ASEA): ETF Research Reports
Original post
Zacks Investment Research
