Singapore’s manufacturing data has been strong for July 2017, driven by strong expansion in the electronics sector. Factory output surged 21% year to date in July. This was way past economists’ expectations of a 12.9% rise. On a monthly basis, it expanded 1%, as against expectations of a 3.9% drop.
All segments of the manufacturing sector expanded in the month, with the electronics segment emerging the best performer. The electronics segment expanded 49.1% in July compared with the year-ago period, per Economic Development Board data.
The rise in global demand for electronics including semiconductors and related equipment led to the surge.
The manufacturing sector contributes to 20% of the country’s GDP. Singapore’s GDP grew 2.9% in the second quarter of 2017 compared with 2.5% growth in the first quarter. It also grew on a year-over-year basis. Moreover, on a seasonally adjusted basis, GDP grew 2.2% sequentially in the second quarter compared with a contraction of 2.1% in the first quarter and above a Bloomberg survey estimate of 2.5%.
Moreover, Singapore is witnessing an increase in business confidence, which improved for the second consecutive quarter. Per Singapore Commercial Credit Bureau (SCCB), the Business Optimism Index rose to 3.58% in the third quarter of 2017 compared with 2.66% in the prior quarter. Moreover, on a year-over-year basis, the index rose to 3.58% in the third quarter compared with 1.11% in the prior-year quarter.
We will now discuss a few ETFs providing exposure to Singapore (see all the Asia Pacific ETFs here).
IShares MSCI Singapore Capped ETF (V:EWS)
This fund focuses on Singapore equities and is the most popular option for exposure to the economy.
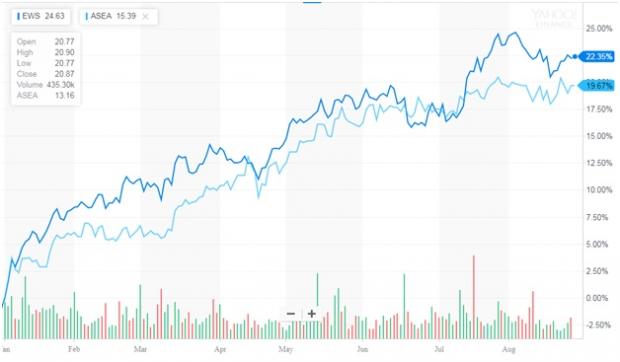
The fund has AUM of $596.76 million and charges 48 basis points in fees per year. Financials, Real Estate and Industrials are the top three sectors of the fund, with 37.20%, 20.93% and 18.20% allocation, respectively (as of August 24, 2017). DBS Group Holdings Ltd, Oversea-Chinese Banking Ltd and United Overseas Bank Ltd are the top three holdings of the fund, with 12.51%, 11.62% and 10.35% allocation, respectively (as of August 24, 2017). The fund has returned 14.35% in the last one year and 22.35% year to date (as of August 25, 2017). EWS currently has a Zacks ETF Rank 3 (Hold) with a Low risk outlook.
We will now compare the performance of EWS to a broader South East Asian ETF, ASEA.
Global X Southeast Asia ETF ASEA
This fund provides broad exposure to the five members of the Association of Southeast Asian Nations, Singapore, Indonesia, Malaysia, Thailand, and the Philippines. It is appropriate for those looking for a diversified exposure to South East Asia (read: Singapore GDP Growth Surpasses Estimates: ETFs in Focus).
ASEA is less popular with AUM of $13.82 million and charges a fee of 65 basis points a year. From a geographical perspective, the fund has 30.45% exposure to Singapore, 22.29% to Malaysia, 21.15% to Thailand, 19.67% to Indonesia and 6.44% to Philippines (as of June 30, 2017). Financials, Telecommunication Services and Industrials are the top three sectors of the fund, with 45.92%, 14.94% and 8.12% allocation, respectively (as of June 30, 2017). DBS Group Holdings Ltd, Oversea-Chinese Banking Ltd and United Overseas Bank Ltd are the top three holdings of the fund, with 7.19%, 7.07% and 5.85% allocation, respectively (as of August 25, 2017). The fund has returned 8.92% in the last one year and 19.67% year to date (as of August 25, 2017). ASEA currently has a Zacks Rank #3 with a Medium risk outlook (read: Indonesia Unexpectedly Cuts Interest Rate: ETFs in Focus).
Below is a chart comparing the year-to-date performance of the two funds.

Source: Yahoo (NASDAQ:AABA) Finance
Want key ETF info delivered straight to your inbox?
Zacks’ free Fund Newsletter will brief you on top news and analysis, as well as top-performing ETFs, each week. Get it free >>
ISHRS-MS SNGPRE (EWS): ETF Research Reports
GLBL-X SE ASIA (ASEA): ETF Research Reports
Original post
Zacks Investment Research
