When they were introduced by REX ETF in May 2016 VMIN and VMAX were the first actively managed volatility Exchange Traded Funds (ETFs). REX’s strategy was to offer higher effective leverage than the popular unleveraged long VXX and the daily resetting inverse volatility funds (XIV & SVXY). In 2017 REX ETF’s strategy paid off with VMIN delivering an eye-popping 190.6 percentage gain, bettering XIV & SVXY returns by 4.7%. For more on how VMIN and VMAX worked during that timeframe see this post.
Then Came February 5th, 2018…
XIV plunged 96% on February 5th, 2018. Since VMIN’s expressed strategy was to offer higher leverage than XIV you’d reasonably have expected VMIN on that date to drop below zero and be terminated—but it didn’t die. It “only” dropped 87%.
How is that possible?
Most likely the managers of VMIN recognized that the end of day VIX futures settlement on the 5th was likely going to be disastrous, and covered at least some of their VIX future short positions before the typical rolling/ rebalancing trade time of ~4:15 PM ET. By acting preemptively they avoided the worst of the VIX Futures end-of-day spike—and dodged what would have been a likely death blow to VMIN.
Reflection often follows a near-death experience and that was the case with REX ETF also. Given the record VIX percentage move and unprecedented level of correlation of the VIX futures with the VIX during the spike, they reasonably concluded that they should reduce the leverage of their funds. REX ETF made that change in allocations starting on March 7th, reaching their target leverage on March 23rd, 2018.
More Time until Expiration
In order to reduce their effective leverage, REX ETF changed VMIN & VMAX’s holdings to a rolling mix of 3rd, 4th, and 5th-month VIX futures. The funds always hold 50% of their assets in the 4th-month futures and allocate the remaining 50% between the 3rd and 5th-month. The 3rd vs 5thmonth holdings shift in proportion to the time remaining until the 3rd month becomes the 2nd-month future. The last contracts in the 3rd-month futures are closed out the night before they become the 2nd-month futures. This algorithm results in a mix of VIX futures that have an effective duration of around 110 days.
The New Leverage Factors
Based on historical patterns this mix of futures should produce VMIN/VMAX percentage moves that are ~0.26 of the CBOE’s VIX’s percentage moves (compared to .51 previously). The comparable metric for Barclays’ VXX is 0.45.
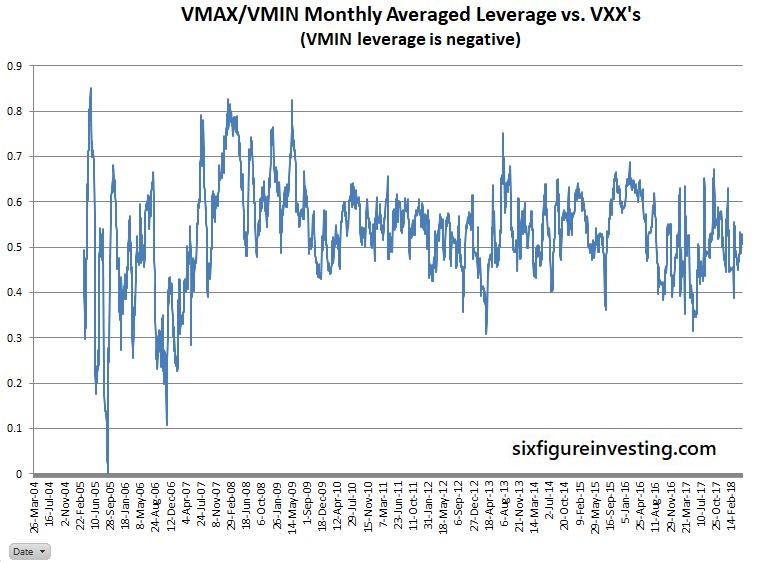
VIX futures and the VIX index don’t always track well (sometimes they go in opposite directions!) so another useful metric is how closely the new VMIN/VMAX will track VXX. I simulated VMIN/VMAX performance, using its new allocation strategy, from 2004 on using the CBOE’s futures historical data. Based on that simulation I’m estimating that the new VMIN/VMIN percentage moves (leverage) will typically be around 0.53X of VXX’s percentage moves. While more consistent than the VIX percentage tracking, this leverage also varies somewhat because the VIX futures term structure between the 1st and 2nd months sometimes shifts relative to the 3rd through 5th months. The chart below shows how that leverage has shifted historically when averaged over a calendar month period.

Drawdown / Termination Risk
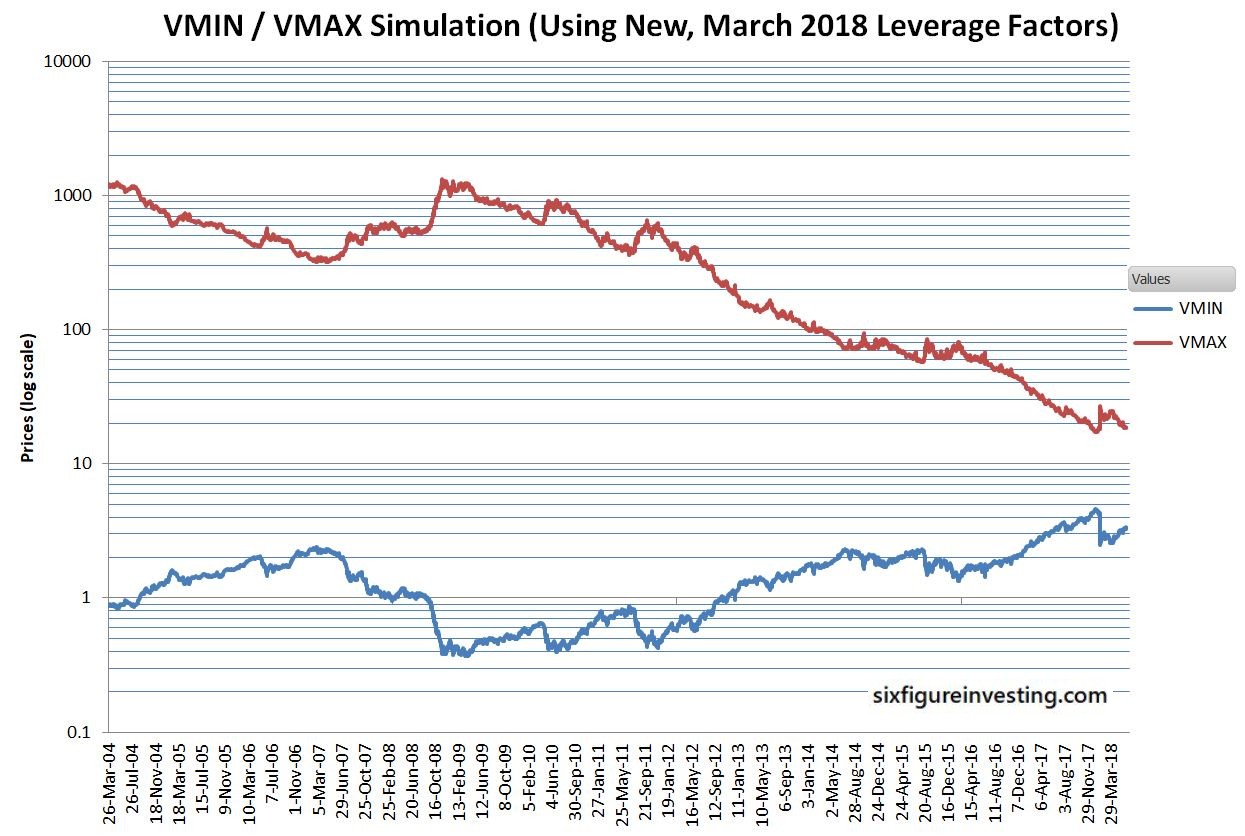
My backtest also allows us to answer questions like how much the new VMIN would have dropped on 5-Feb-2018 (a -38% drop), how it would have fared through the 2008/2009 bear markets (drawdown of 85%), and 2011 correction (drawdown of 51%). A chart of the simulation is shown below.

With this new allocation strategy, VMIN has a much lower risk of termination and reduced drawdowns during volatility spikes—at the cost of not harvesting contango as effectively as the funds with higher leverage.
Fees and Dividends
I have included REX ETF’s annual fees of 2.85% for VMAX and 3.46% for VMIN in the simulation. I could not find any mention of Treasury bill interest in the prospectus so that is not included.
To comply with the securities act of 1940 VMIN and VMAX must distribute any capital gains as dividends at least yearly. I did not attempt to simulate this process, instead, the values shown are effectively adjusted for any splits and dividends assuming that any dividends distributed were immediately reinvested in the funds.
Conclusion
Time will tell whether the February 5, 2018, event was an aberration or foreshadowing of future volatility spikes. The changes to VMIN/VMAX greatly increase their chances of complying with the number one rule of investing—no matter what; make sure you preserve capital to trade another day.
Simulation Spreadsheet
I am making my VMIN/VMIX simulation spreadsheet available for purchase. The spreadsheets start with an index derived from the 3rd through 5th-month VIX futures and include the formulas for computing annual fees and calculating the inverse daily resetting function of VMIN from that index. The spreadsheet does not include the VIX Futures values or formulas for converting from the VIX futures values to the index. If you cannot see purchase information immediately below please click this link and look at the bottom of the page.
If you purchase the spreadsheet you will be directed to PayPal within a few minutes where you can pay via your PayPal account or a credit card. When you successfully complete the PayPal portion you will be shown a “Return to Six Figure Investing” link. Click on this link to reach the page where you can download the spreadsheet. Please email me at vh2solutions@gmail.com if you have problems, questions, or requests. It’s easy to miss the “Return to Six Figure Investing” link. If you don’t get it / can’t find it please email me.
SkuSFI-ETP-VMIN-VMAX NLDescriptionSim of VMIN / VMAX from 2004

