SUMMARY:
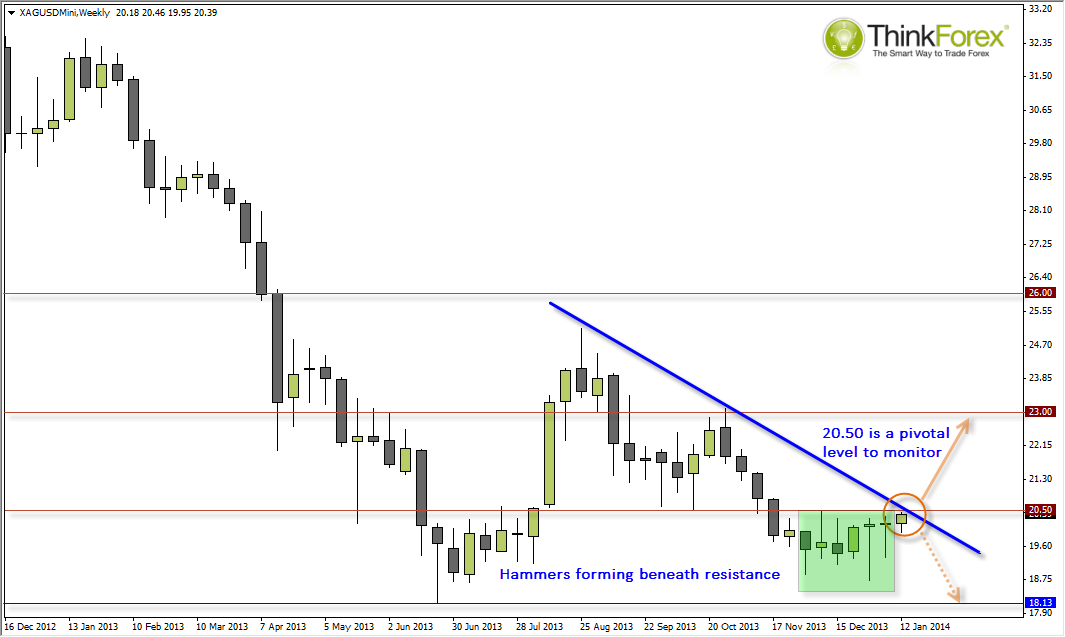
- 20.50 is a pivotal area to watch
- Upward break opens up 23.00
- If this level holds then next target is 18.13 swing low
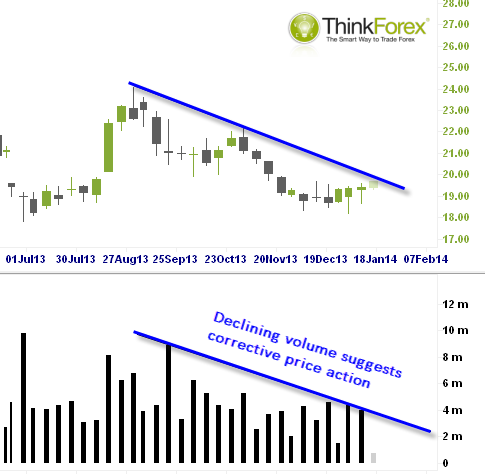
- Decliing volume favours upside breakout, along with Gold and suggest further weakensss for USD
SILVER WEEKLY:
Since the 48.15 high back in May 2011 the primary trend has been clearly bearish. However after rejecting the 18.13 low in June this year, the recent decline appears to be losing momentum and forming buying pressure beneath 20.50 resistances.
We are now in our 8th consecutive week of sideways trading but we have spent the majority of this time at the upper range between 20.50 and 18.13, to suggest the buying pressure. Additionally Hammers have been forming (Bullish and Inverted) to further suggest the weakening of the prior decline from the 25.15 swing high.
At time of writing we reached in interesting juncture as price hovers beneath the resistance level and the declining trendline. On one hand the trendline may indeed hold and see a subsequent move back towards the 148.13 low, and a break below this level to confirm a resumption of the dominant bearish trend from the $25 high.
However an upward break of 20.50 high would be a significant victory for the bulls to suggest a retracement back towards 23.00 on the weekly charts.
In turn this would have weaken the USD, and would presumably correlate with Gold as it has a very string tendency to do. 
iSHARES SILVER ETF: Volume favours corrective price
The chart below is taken from iShares Silver Trust ETF, (SLV) as this also includes volume. We can see how volume has been declining along with price which makes me suspect the move is corrective and pending an upward breakout. 
- English (UK)
- English (India)
- English (Canada)
- English (Australia)
- English (South Africa)
- English (Philippines)
- English (Nigeria)
- Deutsch
- Español (España)
- Español (México)
- Français
- Italiano
- Nederlands
- Português (Portugal)
- Polski
- Português (Brasil)
- Русский
- Türkçe
- العربية
- Ελληνικά
- Svenska
- Suomi
- עברית
- 日本語
- 한국어
- 简体中文
- 繁體中文
- Bahasa Indonesia
- Bahasa Melayu
- ไทย
- Tiếng Việt
- हिंदी
Silver: Bullish Pressure Mounting Beneath 20.50?
Published 01/14/2014, 12:20 AM
Updated 08/22/2024, 06:01 PM
Silver: Bullish Pressure Mounting Beneath 20.50?
Latest comments
Loading next article…
Install Our App
Risk Disclosure: Trading in financial instruments and/or cryptocurrencies involves high risks including the risk of losing some, or all, of your investment amount, and may not be suitable for all investors. Prices of cryptocurrencies are extremely volatile and may be affected by external factors such as financial, regulatory or political events. Trading on margin increases the financial risks.
Before deciding to trade in financial instrument or cryptocurrencies you should be fully informed of the risks and costs associated with trading the financial markets, carefully consider your investment objectives, level of experience, and risk appetite, and seek professional advice where needed.
Fusion Media would like to remind you that the data contained in this website is not necessarily real-time nor accurate. The data and prices on the website are not necessarily provided by any market or exchange, but may be provided by market makers, and so prices may not be accurate and may differ from the actual price at any given market, meaning prices are indicative and not appropriate for trading purposes. Fusion Media and any provider of the data contained in this website will not accept liability for any loss or damage as a result of your trading, or your reliance on the information contained within this website.
It is prohibited to use, store, reproduce, display, modify, transmit or distribute the data contained in this website without the explicit prior written permission of Fusion Media and/or the data provider. All intellectual property rights are reserved by the providers and/or the exchange providing the data contained in this website.
Fusion Media may be compensated by the advertisers that appear on the website, based on your interaction with the advertisements or advertisers.
© 2007-2024 - Fusion Media Limited. All Rights Reserved.
