As we stated a few weeks ago, we thought silver was continuing its bull trend and starting a major leg up. Yesterday it cleared a key level by taking out the $35.69 prior SH (Swing High) from the bounce that occurred late Oct. last year after the CME margin hikes sent the metal reeling. This $35.69 level had not been broken until Monday and the market did so with force.
From an Ichimoku perspective, its really all systems go as the Chikou span formed a favorable cross of price on Dec. 14th last year, but finally cleared the Kumo by the 28th of December telling us this rally should continue.
Price has yet to touch the Kijun since Jan. 13th this year suggesting the trend has strong momentum with it which is also confirmed by the Tenkan which is now pointing nicely upwards.
Traders can look for a rotation back into support around $35.69 for a breakout-pullback or any intraday price action triggers on the 4hr or 1hr time frames, ideally off a 20ema to get back long as we expect this bull trend to continue.
AUD/USD – Breaking Out of The Channel?
The channel we talked about for the Aussie on the daily charts is starting to break and intraday price action is also pointing to this conclusion. A look at the 4hr chart below shows how price held right up against the channel ceiling while the sell-offs on the last two candles produced back to back pinbars off the 20ema. Many of our price action traders go long on these pullbacks to the 20ema and are already in a nice profit with stops brought to BE (breakeven) so they are in a free trade.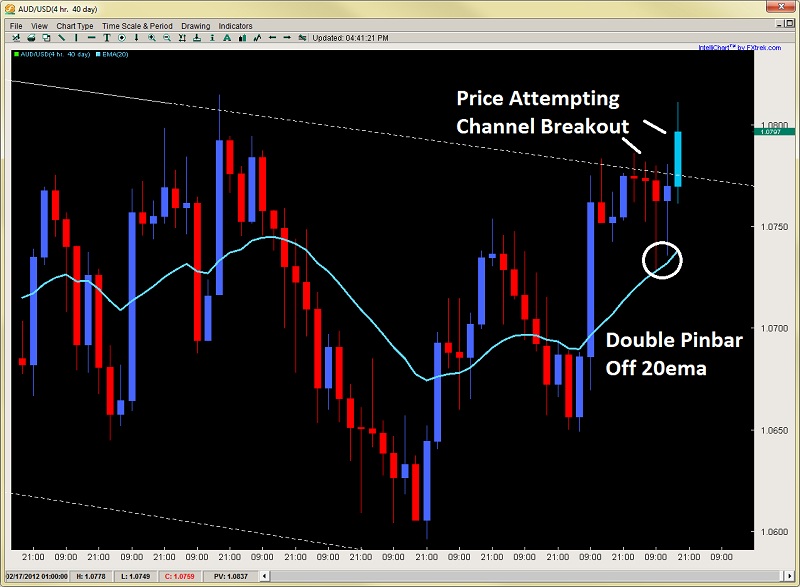 AUD/USD" title="Traders can look for a rotation back into support around $35.69 for a breakout-pullback or any intraday price action triggers on the 4hr or 1hr time frames, ideally off a 20ema to get back long as we expect this bull trend to continue. AUDUSD – Breaking Out of The Channel? The channel we talked about for the Aussie on the daily charts is starting to break and intraday price action is also pointing to this conclusion. A look at the 4hr chart below shows how price held right up against the channel ceiling while the sell-offs on the last two candles produced back to back pinbars off the 20ema. Many of our price action traders go long on these pullbacks to the 20ema and are already in a nice profit with stops brought to BE (breakeven) so they are in a free trade." width="800" height="516">Intraday traders can watch for this candle to close outside the channel which will give extra confirmation of the channel break. If this plays out, then look for a rotation back into the channel top where the last four candles peaked at around 1.0781 for pullback levels to get long. Another option is if the 20ema climbs fast enough, then one can use that as a pullback level but we suspect price is gunning for the yearly highs at 1.0842. It first has to clear the 1.0815 which was the spike high on Feb. 20th so keep an eye for price action clues here.
- English (UK)
- English (India)
- English (Canada)
- English (Australia)
- English (South Africa)
- English (Philippines)
- English (Nigeria)
- Deutsch
- Español (España)
- Español (México)
- Français
- Italiano
- Nederlands
- Português (Portugal)
- Polski
- Português (Brasil)
- Русский
- Türkçe
- العربية
- Ελληνικά
- Svenska
- Suomi
- עברית
- 日本語
- 한국어
- 简体中文
- 繁體中文
- Bahasa Indonesia
- Bahasa Melayu
- ไทย
- Tiếng Việt
- हिंदी
Silver Takes Out Key Resistance
Published 02/29/2012, 04:30 AM
Updated 05/14/2017, 06:45 AM
Silver Takes Out Key Resistance
Latest comments
Loading next article…
Install Our App
Risk Disclosure: Trading in financial instruments and/or cryptocurrencies involves high risks including the risk of losing some, or all, of your investment amount, and may not be suitable for all investors. Prices of cryptocurrencies are extremely volatile and may be affected by external factors such as financial, regulatory or political events. Trading on margin increases the financial risks.
Before deciding to trade in financial instrument or cryptocurrencies you should be fully informed of the risks and costs associated with trading the financial markets, carefully consider your investment objectives, level of experience, and risk appetite, and seek professional advice where needed.
Fusion Media would like to remind you that the data contained in this website is not necessarily real-time nor accurate. The data and prices on the website are not necessarily provided by any market or exchange, but may be provided by market makers, and so prices may not be accurate and may differ from the actual price at any given market, meaning prices are indicative and not appropriate for trading purposes. Fusion Media and any provider of the data contained in this website will not accept liability for any loss or damage as a result of your trading, or your reliance on the information contained within this website.
It is prohibited to use, store, reproduce, display, modify, transmit or distribute the data contained in this website without the explicit prior written permission of Fusion Media and/or the data provider. All intellectual property rights are reserved by the providers and/or the exchange providing the data contained in this website.
Fusion Media may be compensated by the advertisers that appear on the website, based on your interaction with the advertisements or advertisers.
© 2007-2025 - Fusion Media Limited. All Rights Reserved.