Bank economists and bearish gold gurus continue to err, on their gold price predictions. The huge declines they promised in 2014 on the taper never materialized.
They promised that 2015 would bring much lower prices. Instead, gold has already rallied strongly, as I told the gold community it would, because of the bullish news that consistently emanates from Asia.
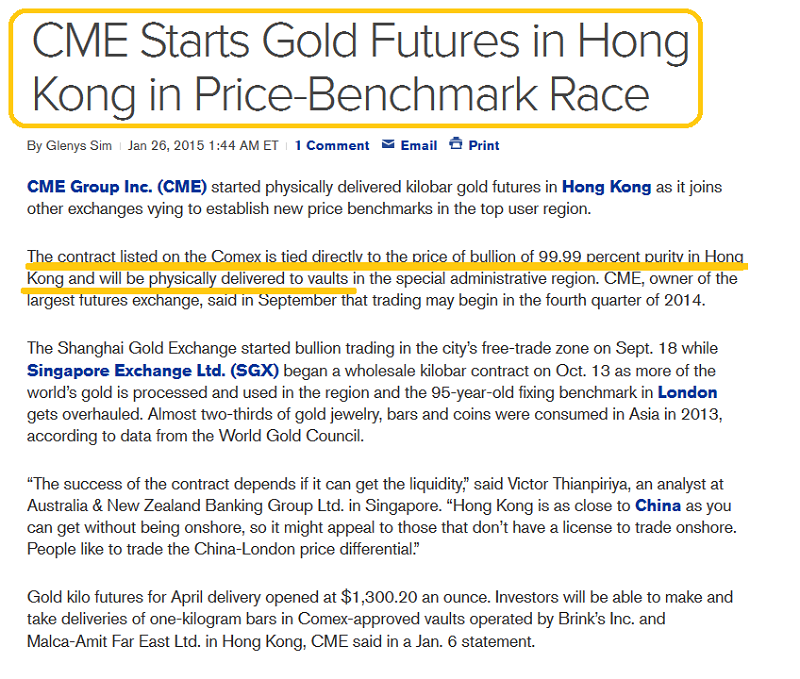
The CME clearly understands that the dominance of Asia in gold price discovery is already here, and is wisely launching products to profit from what I call the “gold bull era”.
In contrast, the bearish Western economists rarely even mention Asia in their gold price analysis. I feel they risk turning themselves into irrelevant “rotary phones”.
The gold market is becoming more stable, as consistent demand for vast amounts of gold jewellery reduces gold price volatility.
As the market gains stability, conservative investors of size are attracted to it. The ideal market is one that rises on inelastic demand, with modest volatility. Gold is that market now.
The US dollar has staged a massive rally against most currencies in early 2015, but it has fallen sharply against gold in the same time frame. Why is that?
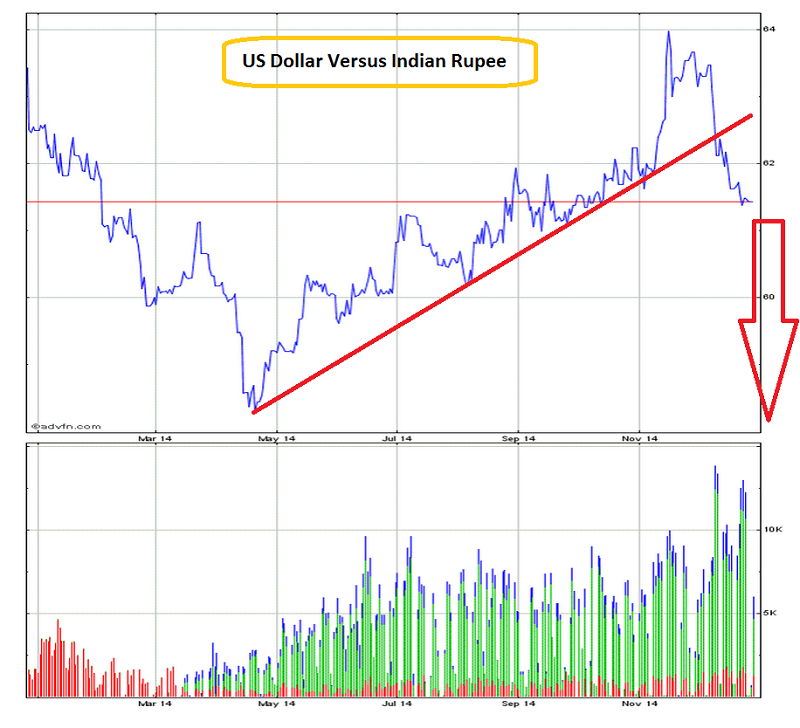
India, and its gold-focused citizens, will dominate the world in the coming decades, and I’m predicting that dominance will beginwithin 18 months.
As the year 2015 gets underway, the US dollar is almost in free fall against the rupee. Only the actions of the Indian central bank are preventing the dollar from suffering an outright crash.
The bank economists are clearly focused on the wrong charts. As price discovery becomes tied to Asian physical bars, it is not the dollar versus the euro or the yen that matters. It is now the dollar versus the rupee that is the fiat key to gold price discovery.
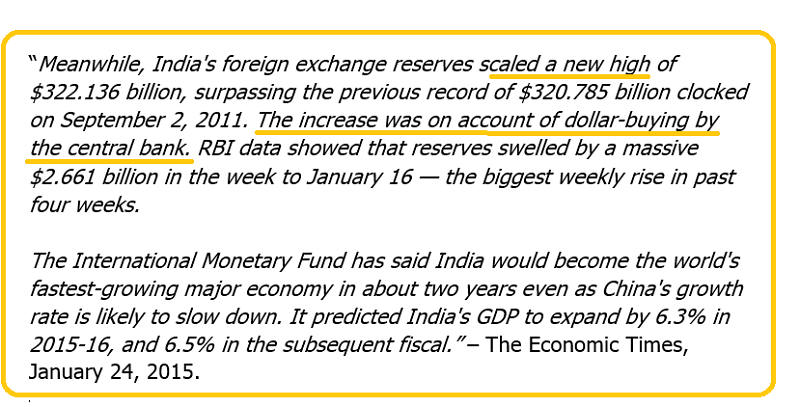
India’s central bank is buying record amounts of dollars, yet the rupee keeps mauling the dollar. In my professional opinion, the Indian nation will have a strong current account surplus, by year-end.
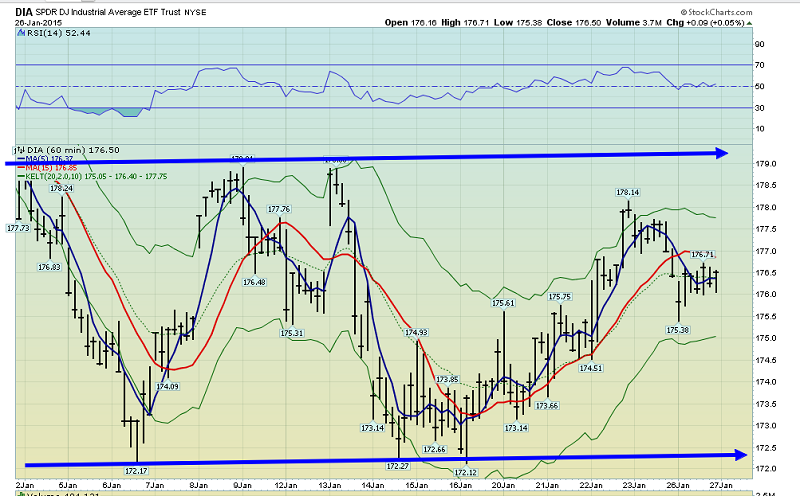
That’s an hourly bars year-to-date chart of the Dow 30, via DIA-NYSE. Horrifically, it looks like a rancid wet noodle.
Faced with the prospect of rate hikes, the end of the business cycle, an aging population that embraces debt as a kind of “super hero”, the Dow has lost momentum and is now a dangerous place for investors!
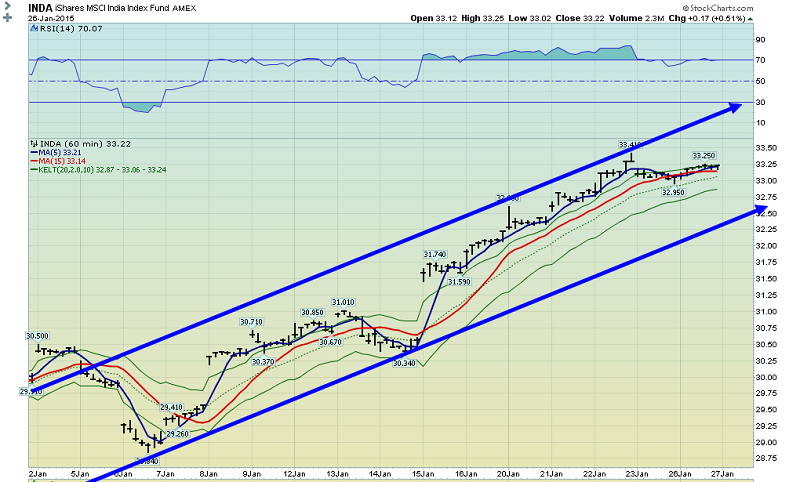
That’s the Indian stock market, via INDA-NYSE.
Powered by the strongest fiat currency in the world, a youthful population, savers and workaholics, the Indian stock market looks like an unstoppable freight train,and I’m definitely on board the train!
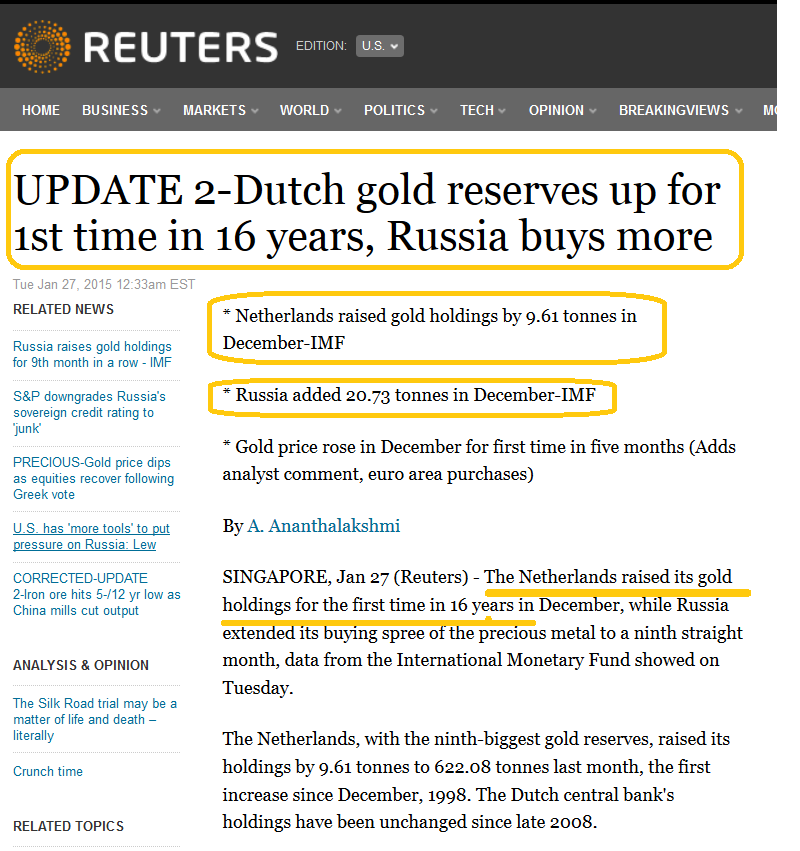
The two key price drivers for gold in 2015 are Chindian jewellery demand and central bank buy programs. For the first time in sixteen years, the Dutch central bank has increased its gold reserves. This could be the beginning of an extensive gold buy program for the Dutch. It follows their successful gold repatriation campaign.
Also, many bank economists predicted that Russia would sell gold reserves in December, and this would cause gold to decline. Instead, Russia added to their reserves! With all due respect, at the rate they are going, the bank economists may soon need somebody to tie their shoelaces.
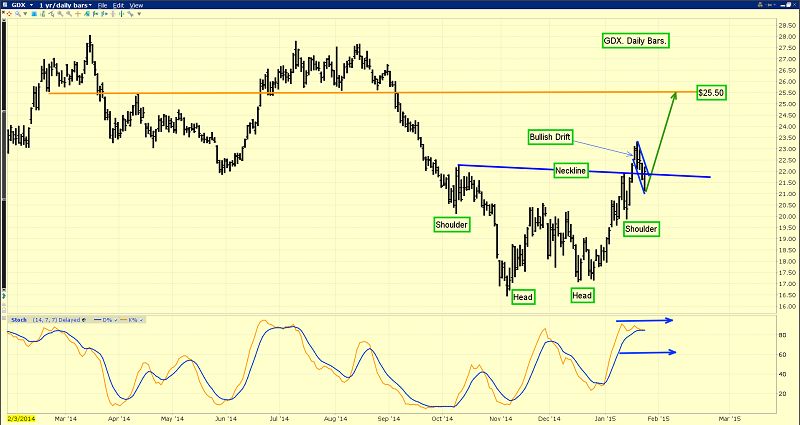
That’s the Market Vectors Gold Miners (ARCA:GDX) daily bars chart. There’s a rare and bullish double-headed inverse head and shoulders bottom pattern in play.
Note the breakout zone around the neckline of this superb pattern. It’s flag-like, but it’s not a full flag pattern. I call it a “bullish drift”.
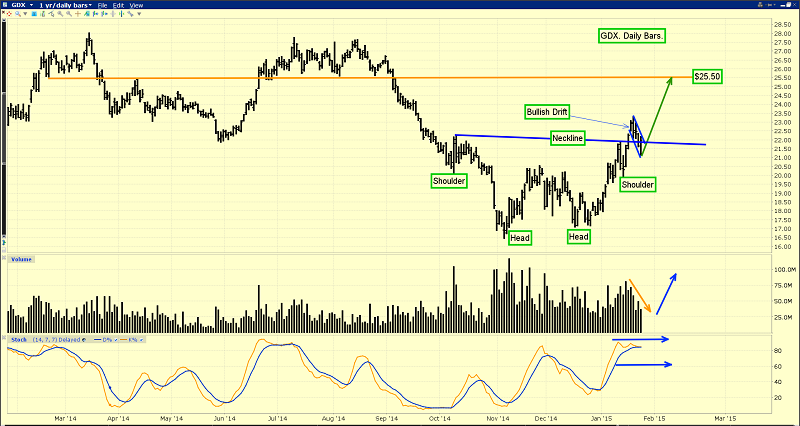
That’s a second look at the GDX chart, with a focus on volume. Some technicians wrote to me yesterday, worried that while GDX rose in price yesterday, the volume declined. Volume must be studied from a perspective of the minor price trend,not just the daily closing action. Note how volume has declined as the price drift occurred. That’s extremely bullish.
As gold arrived in the $1305 area, I issued a light profit booking signal to my subscribers. I suggested that gold could decline to the $1258 or $1240 area.
While that’s still possible, the bearish sentiment that appears to have suddenly enveloped many gold community investors, leads me to believe that a charge toward $1348 is the more likely scenario now!
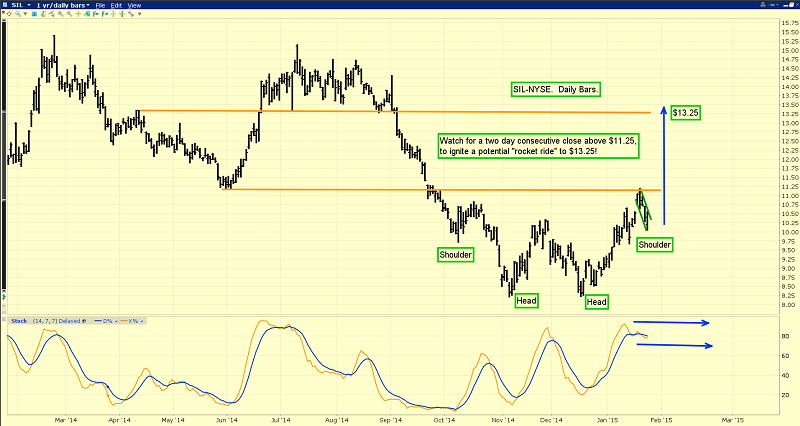
As good as gold stocks look, silver stocks look even more spectacular. That’s the daily SIL-NYSE chart. There’s a bullish inverse head and shoulders pattern in play, and my immediate term target is $13.25, if SIL can close above $11.25 for two consecutive days. This should be a spectacular year for enthusiastic silver stock investors.
Written between 4am-7am. 5-6 issues per week. Emailed at aprox 9am daily.
Stewart Thomson is a retired Merrill Lynch broker. Stewart writes the Graceland Updates daily between 4am-7am. They are sent out around 8am-9am. The newsletter is attractively priced and the format is a unique numbered point form. Giving clarity of each point and saving valuable reading time.
Risks, Disclaimers, Legal
Stewart Thomson is no longer an investment advisor. The information provided by Stewart and Graceland Updates is for general information purposes only. Before taking any action on any investment, it is imperative that you consult with multiple properly licensed, experienced and qualified investment advisors and get numerous opinions before taking any action. Your minimum risk on any investment in the world is: 100% loss of all your money. You may be taking or preparing to take leveraged positions in investments and not know it, exposing yourself to unlimited risks. This is highly concerning if you are an investor in any derivatives products. There is an approx $700 trillion OTC Derivatives Iceberg with a tiny portion written off officially. The bottom line:
Are You Prepared?
