The Silver market is always popular with metal investors, it's relatively cheap to own an ounce compared to, say Gold, so you can certainly hoard plenty of it. In fact, most metal dealers will happily sell you a Silver coin or ingot if you want one. Investors who play the markets a little more extensively will be watching Silver closely since the current market looks to be a bit flat. Stuck around the $19-21 mark, Silver was relatively quiet over the last two months.
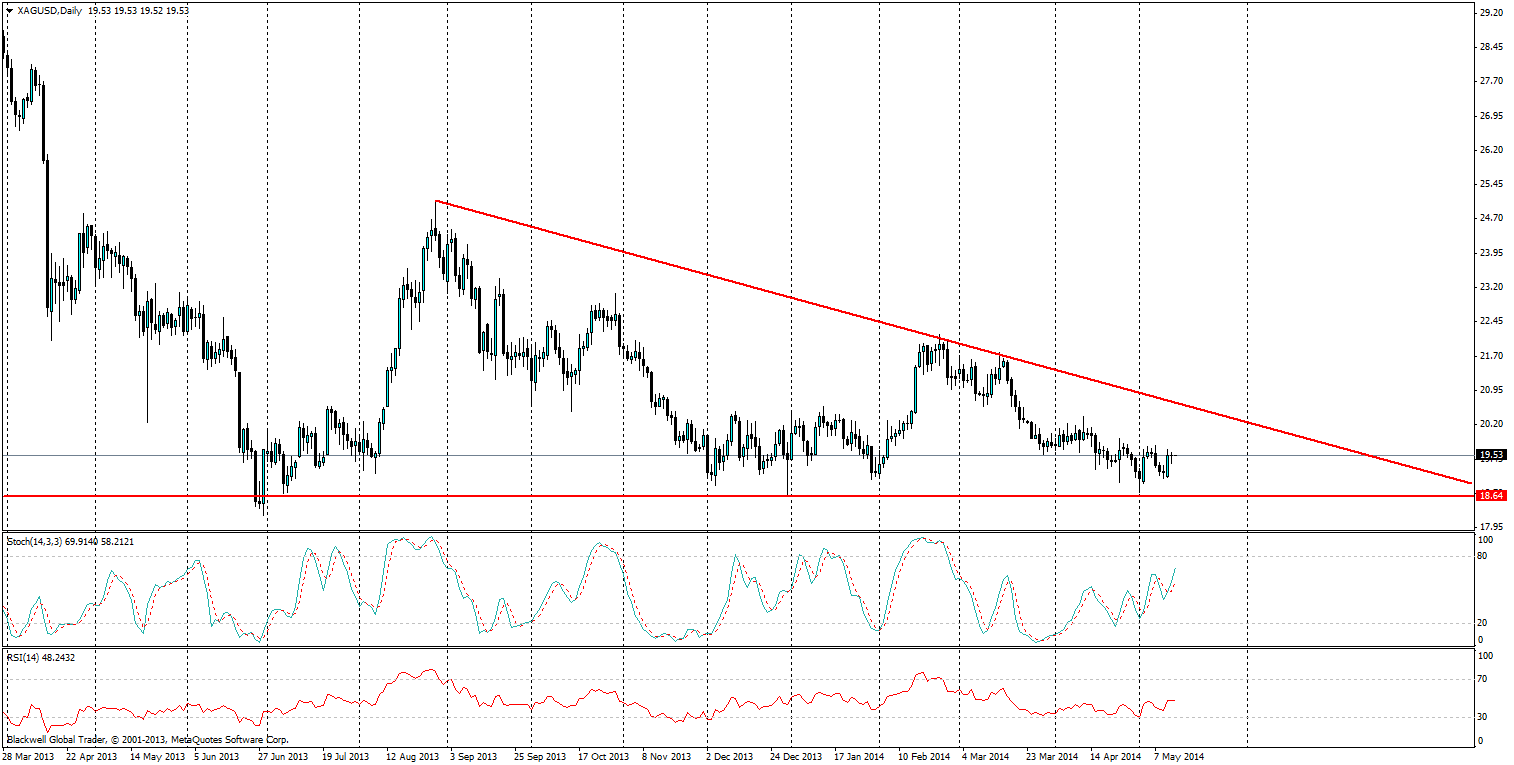
On the long term charts, we can see that Silver has been stuck in a downtrend but at the same time, it has yet to really smash through the bottom of the descending triangle that has formed.

Source: Blackwell Trader
A descending triangle pattern is generally followed by a breakout lower, equal to the highest point. In this case, I think a breakout lower may indeed happen eventually, but the reality might be a little less than the full 6 dollars which would push Silver to around 12-13 dollars. Silver still has demand as a global hedge in panics, and of course industrial applications.
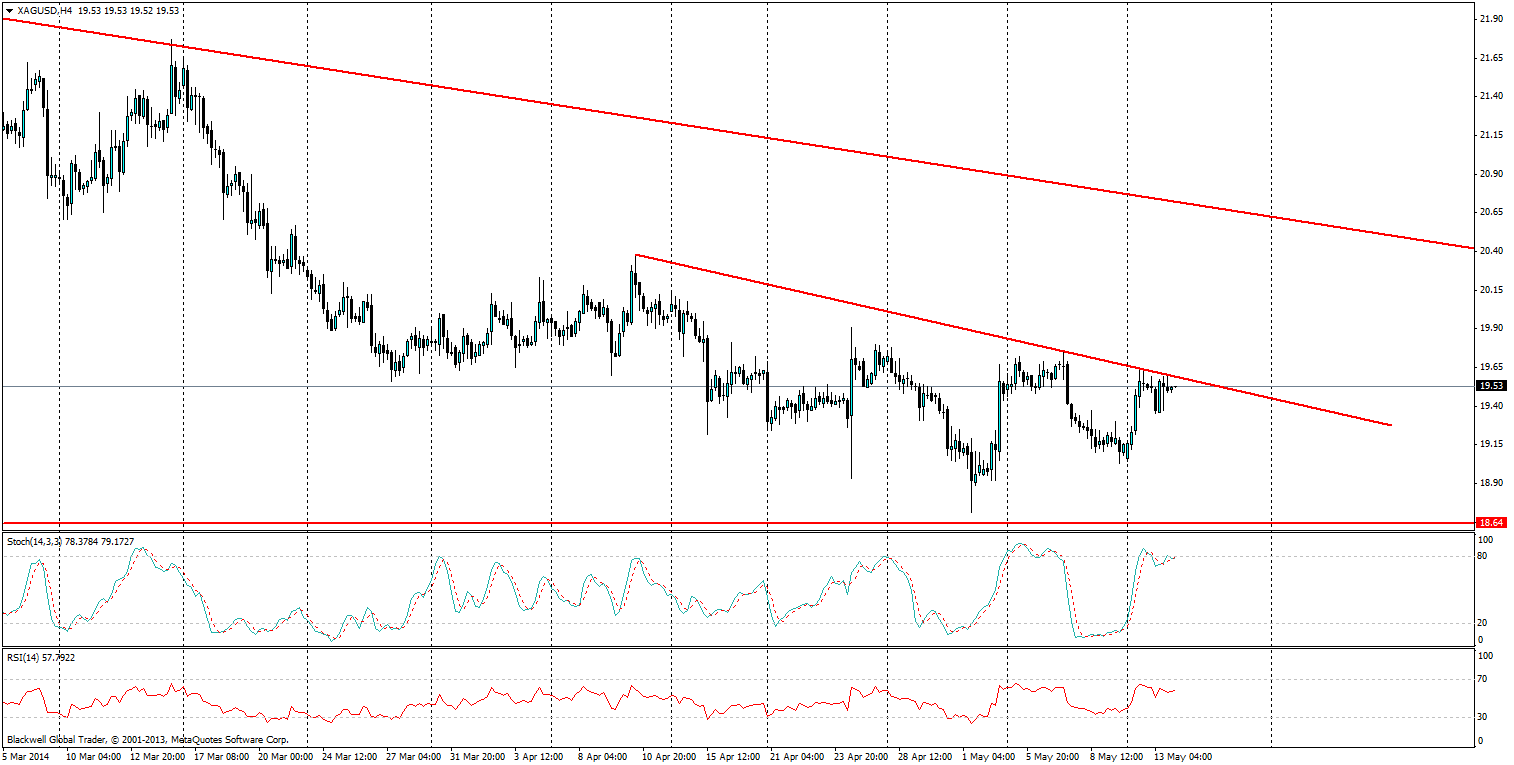
We have established that Silver is in a downward trend as of late and it’s certainly got room to move even lower.

Source: Blackwell Trader
The 4 hour chart shows no difference despite momentum being on the buy side and the RSI shows buying pressure. Both look to be false signals in the current market climate, especially when markets have so far been moving southward. The current trend line on the H4 chart is surprisingly strong, but should remain in play in the near term though a consolidation on the trend line could signal that the markets are looking to move higher, and look to test the daily descending triangle pattern.

Source: Blackwell Trader
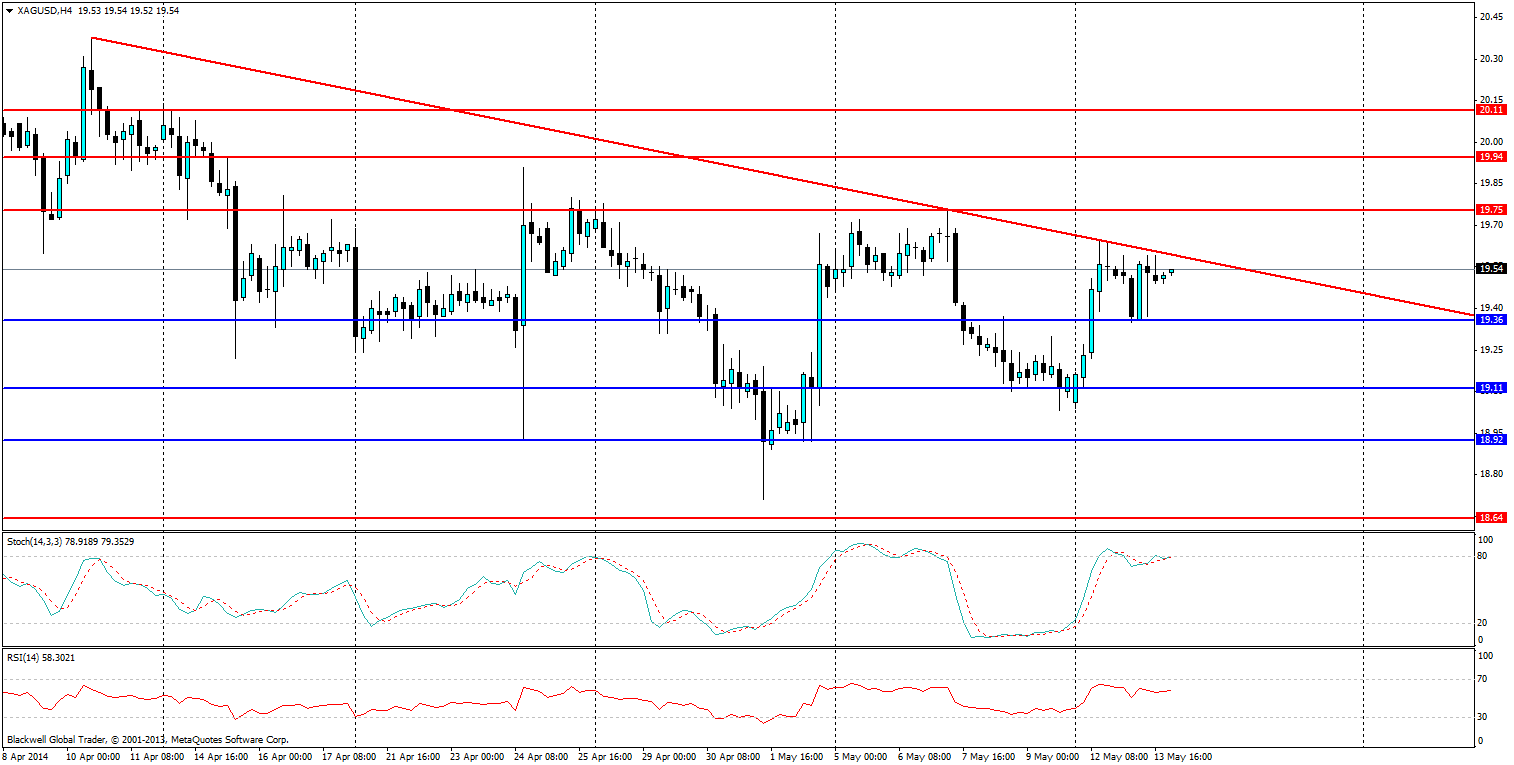
Either way, the resistance lines that are key for future rises are 19.75, 19.94 and 20.11; with the trend line likely to act as dynamic resistance in the near future until it breaks. Support levels will likely be placed at 19.36, 19.11 and 18.92. The bottom of 18.64 represents the current price floor on the descending triangle pattern. It’s likely that any fall down to the bottom will be pushed back this early on though.
While metals markets have been in a rut for some time and have been falling for the last couple of years, this looks likely to continue, and certainly so in the Silver market. The H4 chart is something worth paying attention to in the short term for traders out there, but the daily triangle is the main thing that many traders should be watching. Any breakout from that should be followed by 2 candles at least to confirm it, as it will be heavy and many people will be careful of a fake breakout. But for the time being, things are certainly still looking a little bearish.
