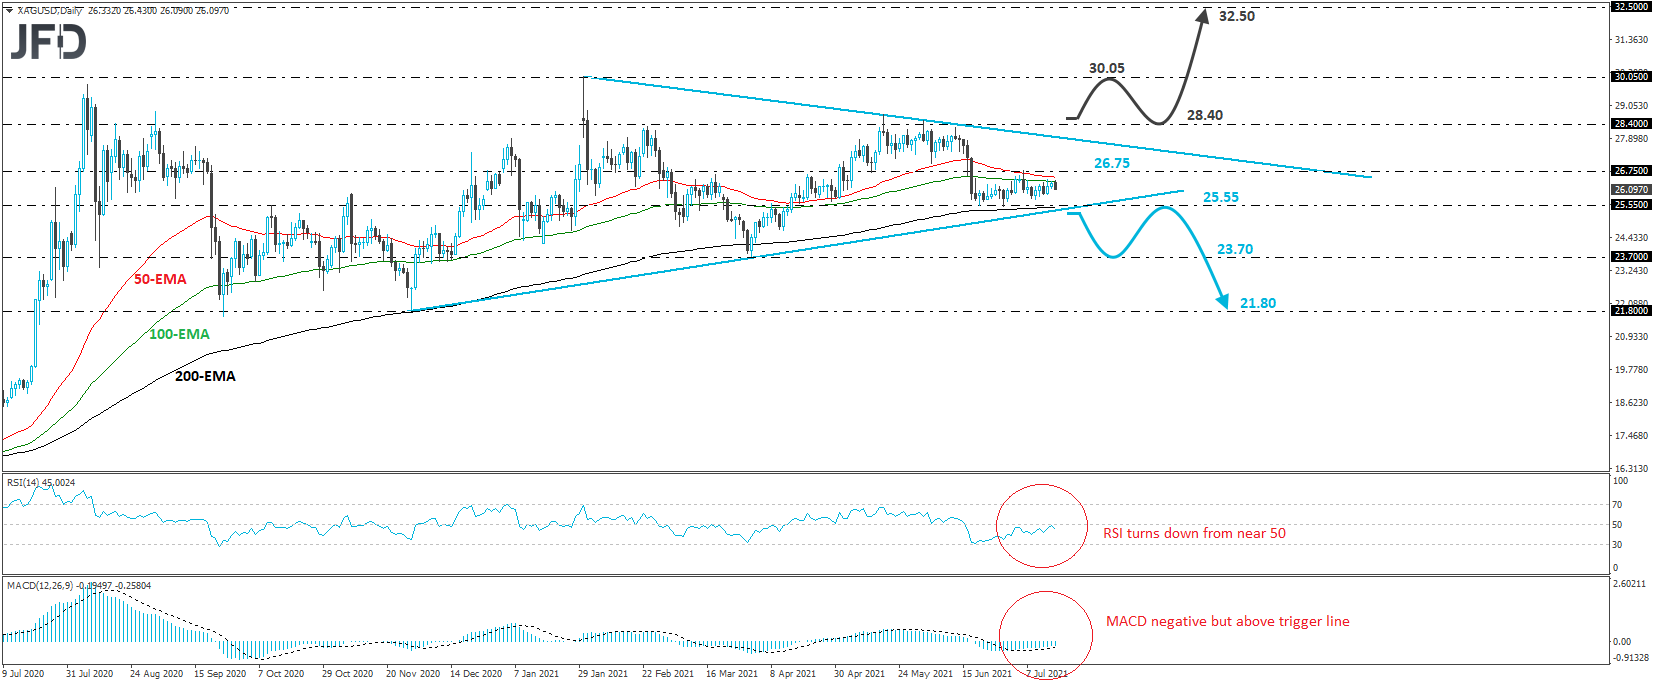
XAG/USD has been trading in a consolidative manner since June 17, between the 25.55 and 26.75 barriers. The broader picture looks directionless as well. The metal continues to hover above the upside support line drawn from the low of Nov. 30, as well as below a downside one taken from the high of Feb. 1.
Therefore, we prefer to wait for a break through one of those lines before we start examining whether the outlook has changed to positive or negative.
A dip below the upside line, as well as below the 25.55 barrier, would confirm a forthcoming lower low on the daily chart and may encourage the bears to drive the battle towards the low of Mar. 31, at around 23.70. If that hurdle doesn’t hold, its break may lead to the 21.80 territory, which provided strong support on Sept. 24 and Nov. 30.
Shifting attention to our daily oscillators, we see that the RSI has turned down after hitting resistance at 50, while the MACD, although negative, lies above its trigger line. Both indicators lie near their equilibrium lines, providing conflicting momentum signals. This enhances our choice to stay flat for now and wait for the white metal to break one of the two aforementioned diagonal lines.
On the upside, a break above the key resistance zone of 28.40 may be the catalyst for the bulls to jump massively into the action. This would not only confirm the break above the downside line taken from the high of Feb. 1 but would also confirm a forthcoming higher high. The next stop may be the high of Feb. 1, at around 30.05, the break of which would take silver into territories last seen back in February 2013, with the next potential resistance perhaps being the 32.50 zone, defined by the high of Jan. 23.