Do not tell silver speculators that the Federal Reserve is tightening monetary policy.
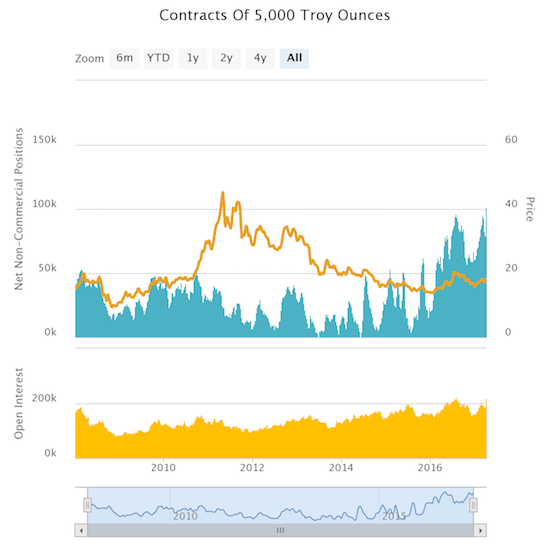
The latest CFTC Commitments of Traders (CoT) report showed that silver speculators ran net long contracts to a new high, levels not seen since at least 2008. The increase in open interest confirmed the bullishness of silver speculators.

Silver speculators ramp bullishness to new heights.
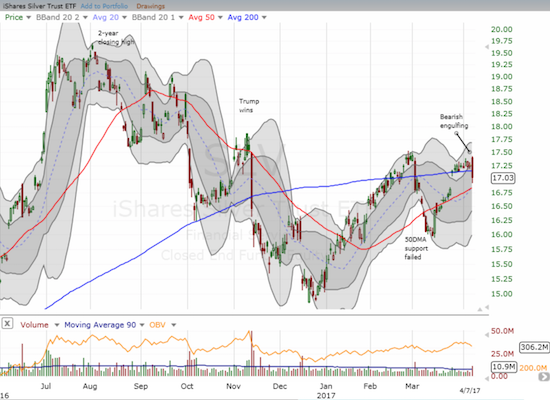
Speculators last set a new 2008+ high in the summer of 2016 in the wake of Brexit. When speculators came just short of that high on February 27, 2017, the iShares Silver Trust (NYSE:SLV) traded at what remains the 2017 high and just short of a post-election high. Until a steep mid-day decline on Friday, SLV traded essentially at that same level. Now I wonder whether SLV just hit another short-term peak.

Friday’s fade plunged the iShares Silver Trust (SLV) through 200DMA support and confirmed resistance at the 2017 high. 50DMA support is back in play.
Just like the plunge on March 2nd, the key for SLV is the follow-through. On March 3rd, a small relief rally fell short of 200DMA resistance; two days later SLV gapped down on its way to a 50DMA breakdown. I am guessing that SLV could at least retest the March low in the current move.
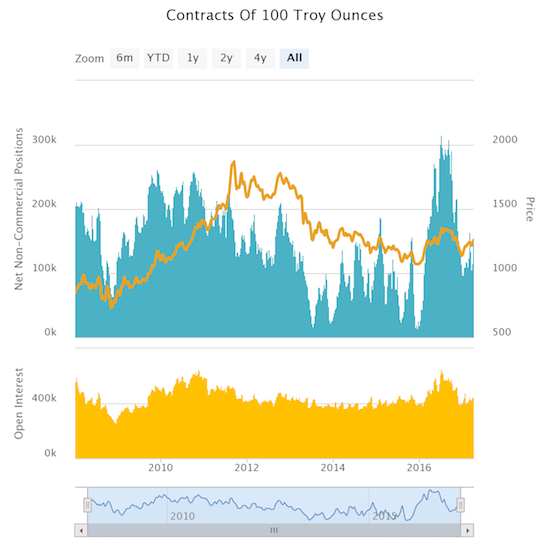
The surprising part of the bullishness in silver is that gold speculators are nowhere close in conviction. Net contracts are long, as they have stayed since at least 2008, but are far short of the peak from the summer of 2016 that set a 2008+ high. Indeed, current levels are quite “normal” relative to the post-2008 period.

Gold speculators are nowhere near last summer’s historic levels of bullishness.
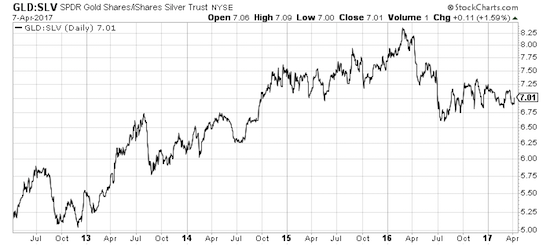
Silver speculators have received little reward for their relatively out-sized bullishness. The following chart shows the ratio between the SPDR Gold Shares (NYSE:GLD) and SLV. The choppy uptrend in GLD/SLV finally came to an end in early 2016, but the ratio has gone nowhere since last July when the bullishness of gold speculators began fading faster than that of silver speculators.

GLD’s out-performance to SLV ended last year but SLV has failed to make further progress since the summer.
I do not know why silver speculators are so far ahead of gold speculators in their optimistic assessment of their respective precious metals. I would love to hear some ideas!
I daresay this juncture is a great one for a pairs trade featuring long GLD versus short SLV. It is not a trade I would take on since I have a very strong preference for bullish positions in precious metals. This same bias moved me to take the long GLD side of my gold versus bonds pairs trading. Regardless, I acknowledge SLV has notable (short-term) downside risk here given speculators may have over-reached on their maximum bullishness.
Full disclosure: long GLD shares and call options, long SLV
