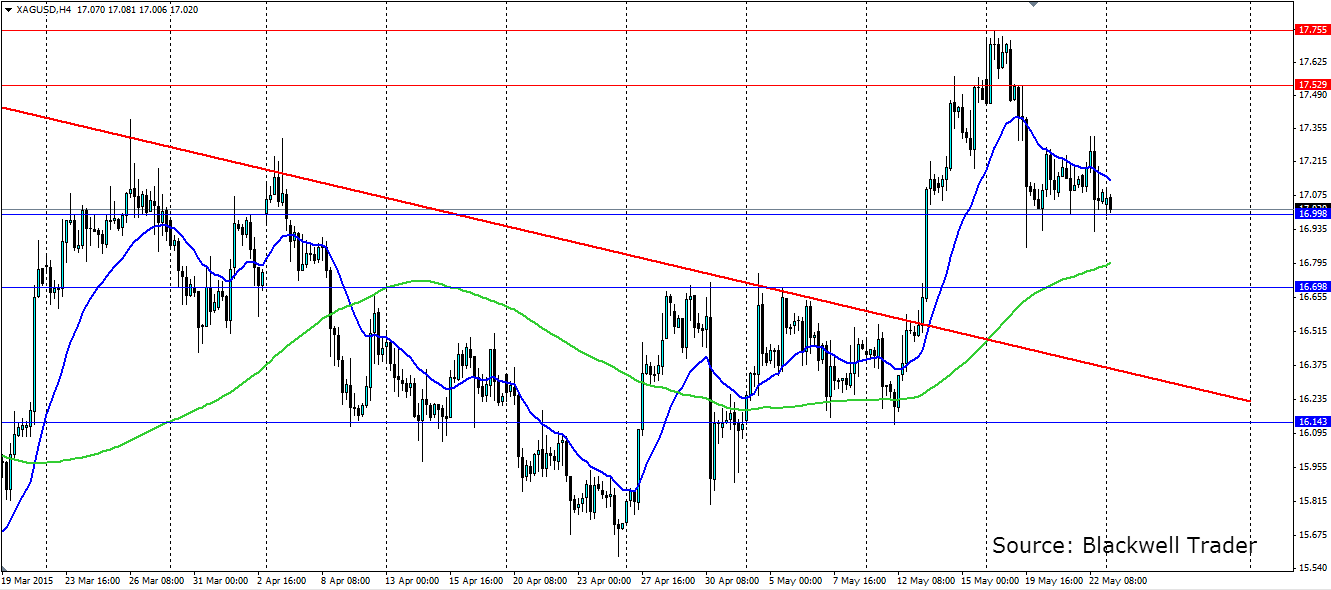
Silver has been charging up the charts ever since it broke out of the bearish trend it was trading under for some time. That bullish push now looks to have come to an end with a large head and shoulders pattern forming. 
Last week’s speech by Fed Chairwoman Janet Yellen and the FOMC minutes earlier in the week did not really surprise anyone in the metals markets but they did add some volatility to the precious metal. A rate rise in June is all but ruled out, and most analysts are picking a rise in September, but this will all depend on economic data. For now the US looks a little shaky, but for the most part silver will not see any strong trends until the timing of rate rises becomes clearer.
The head and shoulders pattern that has formed on the silver H4 chart above is not a classic, text-book example of the pattern, but the structure will nonetheless have the same effect. It is certainly a top pattern that points to the turning sentiment between the buyers and the sellers with the sellers coming out on top, but the buyers aren’t going out without a fight. The lower highs seen on the most recent candles show this fight.
There are also some news items out of the US which could add some direction to Silver. US Core Durable Goods, Consumer Confidence, Home Sales, Unemployment Claims and consumer confidence are all things to watch out for this week. The data has not been too flash out of the US recently so expect some mixed messages.
The price of silver has pulled back up to the ‘neck-line’ which, if it holds, will likely see a strong rejection that will target the previous bearish trend line as support. Watch for the 100 H4 SMA as this will likely act as dynamic support on the way down. Firm support will be found at 16.998, 16.698 and 16.143 while resistance is found at the current level of 17.191, 17.529 and the recent top at 17.755.
- English (UK)
- English (India)
- English (Canada)
- English (Australia)
- English (South Africa)
- English (Philippines)
- English (Nigeria)
- Deutsch
- Español (España)
- Español (México)
- Français
- Italiano
- Nederlands
- Português (Portugal)
- Polski
- Português (Brasil)
- Русский
- Türkçe
- العربية
- Ελληνικά
- Svenska
- Suomi
- עברית
- 日本語
- 한국어
- 简体中文
- 繁體中文
- Bahasa Indonesia
- Bahasa Melayu
- ไทย
- Tiếng Việt
- हिंदी
Silver Ripe For Reversal
Published 05/25/2015, 01:32 AM
Updated 05/14/2017, 06:45 AM
Silver Ripe For Reversal
Latest comments
Loading next article…
Install Our App
Risk Disclosure: Trading in financial instruments and/or cryptocurrencies involves high risks including the risk of losing some, or all, of your investment amount, and may not be suitable for all investors. Prices of cryptocurrencies are extremely volatile and may be affected by external factors such as financial, regulatory or political events. Trading on margin increases the financial risks.
Before deciding to trade in financial instrument or cryptocurrencies you should be fully informed of the risks and costs associated with trading the financial markets, carefully consider your investment objectives, level of experience, and risk appetite, and seek professional advice where needed.
Fusion Media would like to remind you that the data contained in this website is not necessarily real-time nor accurate. The data and prices on the website are not necessarily provided by any market or exchange, but may be provided by market makers, and so prices may not be accurate and may differ from the actual price at any given market, meaning prices are indicative and not appropriate for trading purposes. Fusion Media and any provider of the data contained in this website will not accept liability for any loss or damage as a result of your trading, or your reliance on the information contained within this website.
It is prohibited to use, store, reproduce, display, modify, transmit or distribute the data contained in this website without the explicit prior written permission of Fusion Media and/or the data provider. All intellectual property rights are reserved by the providers and/or the exchange providing the data contained in this website.
Fusion Media may be compensated by the advertisers that appear on the website, based on your interaction with the advertisements or advertisers.
© 2007-2025 - Fusion Media Limited. All Rights Reserved.
