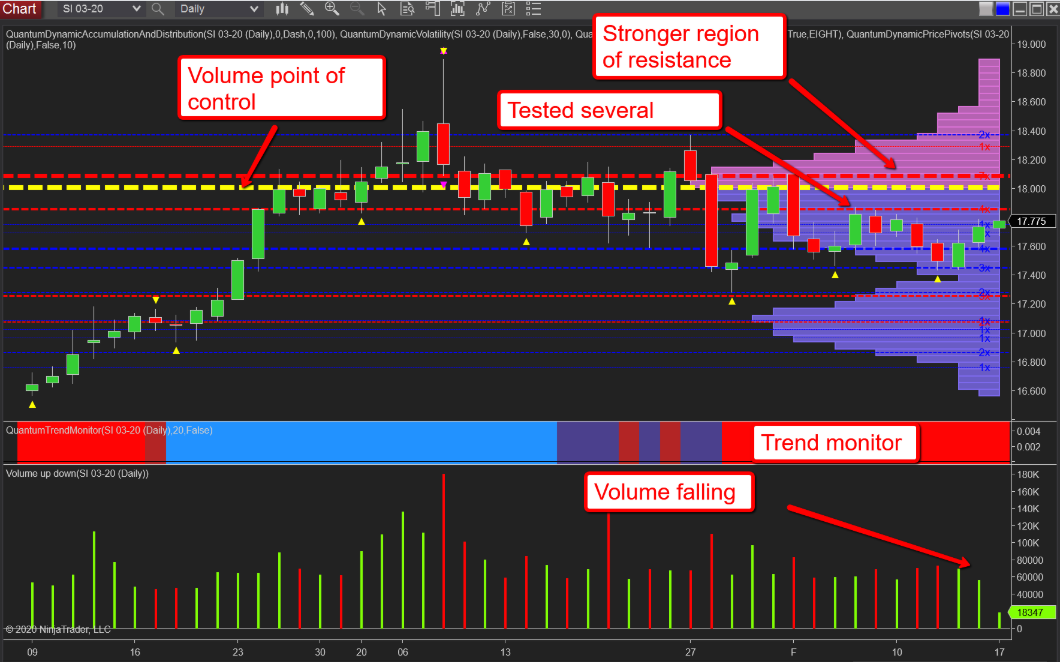
As we would expect, silver and gold correlate relatively closely and with gold pushing higher, the industrial metal is doing its best to follow suit, albeit in a somewhat labored way. From a technical perspective, the daily chart for silver is a rather different proposition as we have several layers of resistance in place overhead.
The Layers
The first level is one that has been tested several times recently at $17.87 per ounce, a price that has already been tested. From there, it’s a short hop to $18 per ounce where the VPOC (volume point of control) itself resides and is denoted with the yellow dashed line. This is followed immediately by a stronger area of resistance at $18.10 per ounce. And once clear of this congested region, volume on the histogram on the y-axis falls away and low volume extends from $18.30 per ounce. So if this level can be achieved, any surge in gold would pull silver through this region. However, note the trend monitor indicator, which remains bearish, and if and until we see a change to a darker red or dark blue, any bullish sentiment for silver will depend on its more illustrious cousin, gold.
Finally, we can see volume has fallen away over the last couple of days and looks weak for the time being
Charts from NinjaTrader and indicators are my own and available from Quantumtrading
