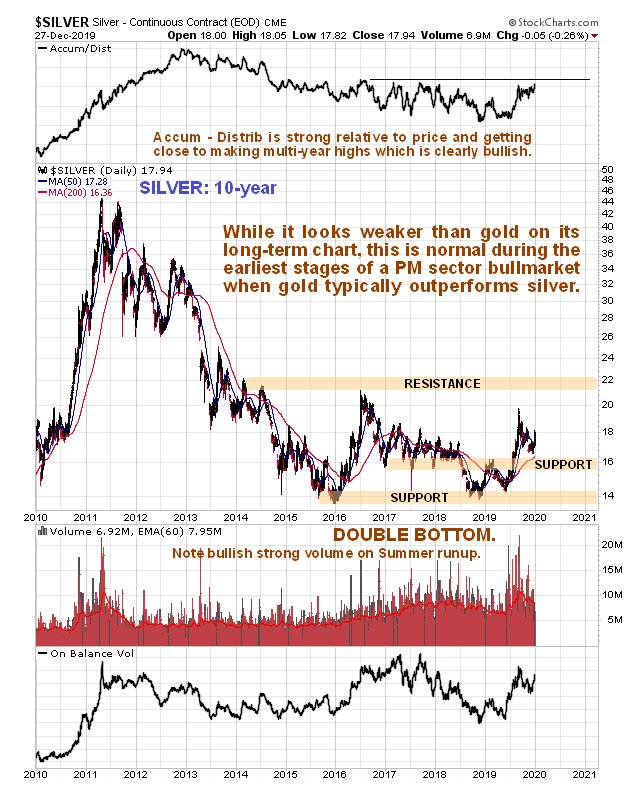
While silver’s charts do not yet look as positive as gold’s, that is normal at this early stage in the cycle, when gold is favored over silver, which attracts more speculative interest as the bull market progresses. Nevertheless, as we can see on the latest 10-year chart for silver below, it is starting to look a lot better as it hauls itself up out of the second low of the giant Double Bottom pattern shown. Gold’s advance and Summer breakout triggered a strong impulse wave in silver, which then reacted back to support above its rising 200-day moving average. Last week it turned higher to start its 2nd impulse wave, which, given the increased risk of the dollar dropping hard, has a good chance of making a run at the resistance level shown. Technically, it is still within the base pattern until it succeeds in breaking above the resistance at and approaching its 2016 highs. Once it does the advance is likely to accelerate.

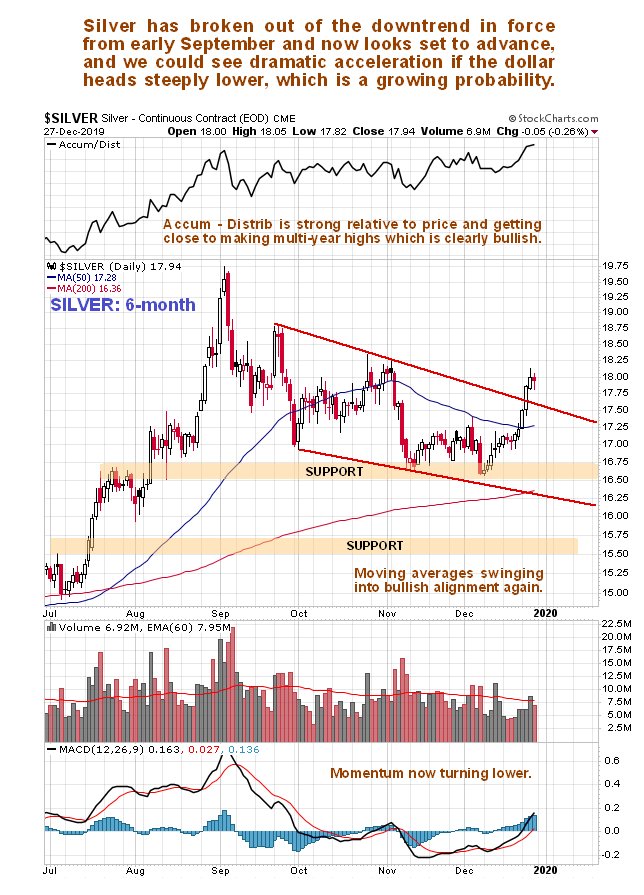
On the 6-month chart we can see that we now a very bullish setup, with the price breaking out of the reactive downtrend in force from early September just last week. With the Accumulation line already making new highs for recent months, moving averages in very favorable alignment and momentum (MACD) swinging positive it looks like all systems go for silver here, regardless of any minor short-term reaction.

While the COTs sound a note of caution, the argument set out with respect to them for gold in the parallel Gold Market update applies equally to silver, so it will be repeated here - the situation requires a rethink given the rapidly changing environment that we are moving into. Whilst we recognize that readings are at levels that normally lead to a significant reaction, the current setup suggests that readings are likely to stay high as this bull market progresses, only moderating somewhat on minor corrections, and of course there is nothing to say that Commercial short and Large Spec long positions can’t reach higher levels in the event of silver continuing to advance. So we should be mindful of COT readings and be aware that from now on they are likely to fluctuate around mean levels that are considerably higher than they have been in recent memory.

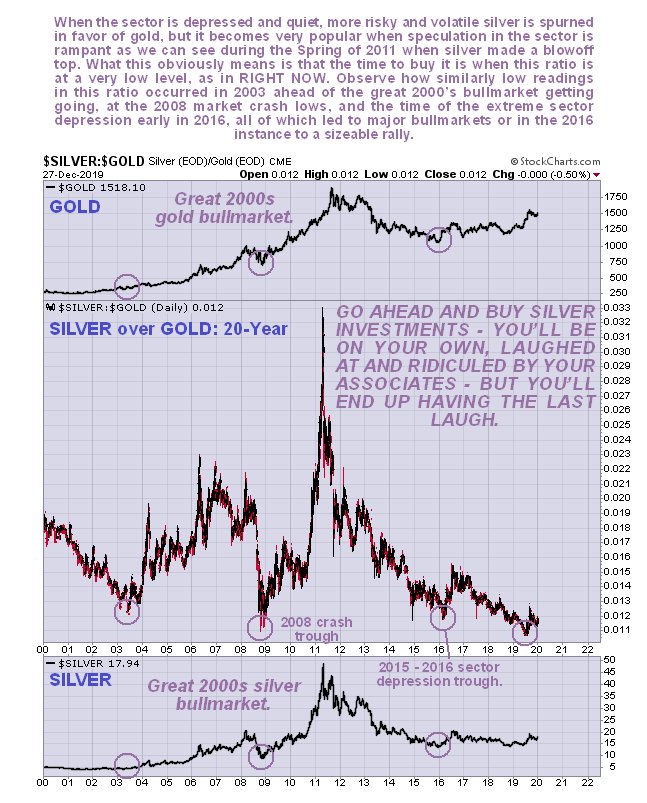
There is a “perfect storm” of bullish factors coming together for copper, gold and silver, chief of which is the exponential ramping of money creation in order to try to stop the system from imploding due to extreme debt. This being so silver looks extraordinarily cheap here with its price being way below its 2011 highs, especially taking inflation into account, and not far off its lows of recent years. With gold already forging ahead, we can expect silver to play catchup. This is therefore thought to be an excellent time to accumulate a wide range of silver investments with a view to holding most of them for the longer-term, and we will of course by covering them on the site.
