Silver Market Update: Outlook Remains Favorable

Published 01/13/2020, 01:08 AM
Silver 6 Month - Daily Chart

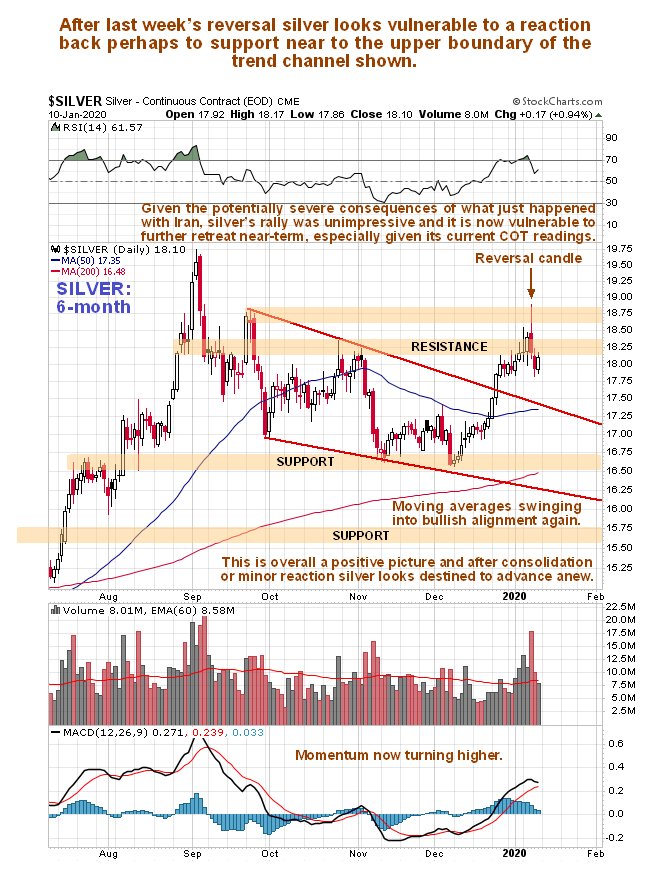
Silver’s recent rally looks diminutive and stunted compared to gold’s, but that’s normal at this early stage of a new bullmarket, when silver typically underperforms gold due to investors being risk inverse, with silver being perceived as more risky and volatile than gold. Nevertheless, as we can see on its latest 6-month chart, silver did manage to break out of its reactive downtrend in force from early September. Last week, at the time Iran lobbed missiles at US bases in Iraq it had a go at breaking above its late September highs, but was not up to the task and fell back, putting in a reversal candle on big volume, which suggests that it probably has further to fall short-term – perhaps back to the upper boundary of the downtrend channel shown, but with the overall tenor of this chart positive it should then turn higher again.

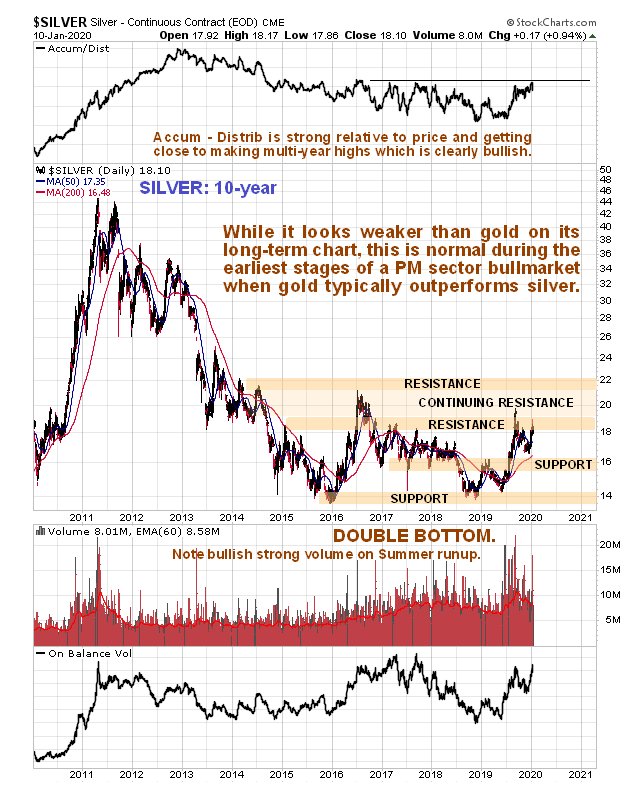
Wheeling out the 10-year chart once more, which gives us the big picture, we see that, although so far looking much more restrained than gold, silver appears to be ascending away from the second low of a giant Double Bottom pattern. The advance out of the lows of last Summer was on good volume, that has driven both volume indicators quite strongly higher, which is bullish and marks a breakout drive out of the base pattern, with a completed breakout being signaled by silver breaking above the resistance approaching and at $22. A break above this level will usher in a period of much more dynamic advance.
Silver 10 Year - Daily Chart

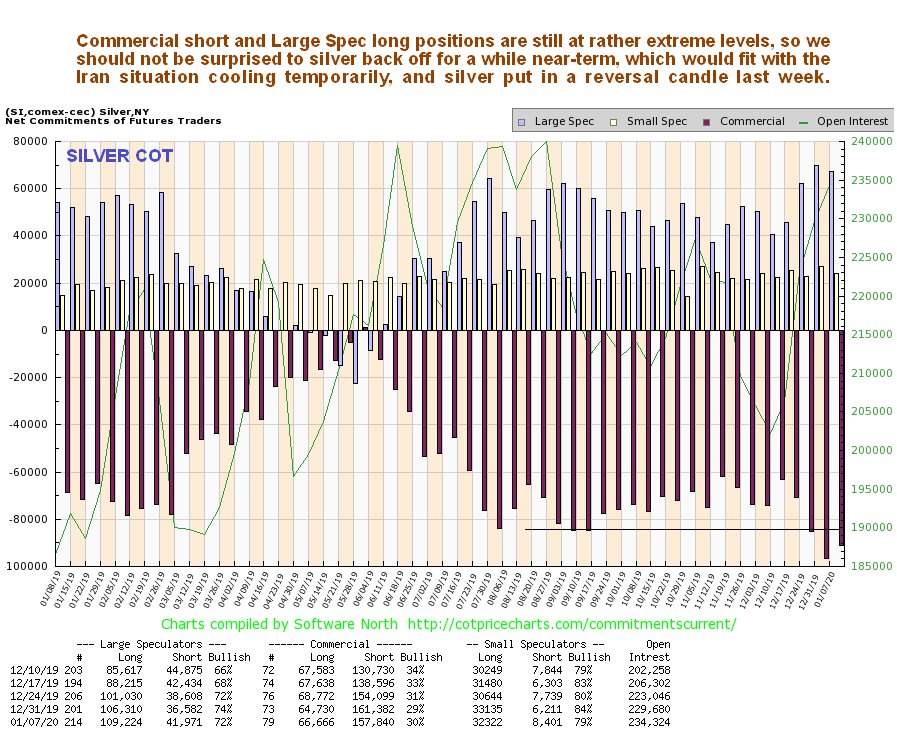
The latest COT chart shows that Commercial short and Large Spec long positions are still at fairly extreme levels, which makes more corrective action over the near-term likely…
Silver COT Report

Conclusion: Although last week’s reversal candle and the current rather extreme COT readings make short-term weakness likely, perhaps to the upper boundary of the Fall downtrend, the overall picture for silver is favorable, with it readying to break out of a giant 5-year plus base pattern to follow gold higher. Marked acceleration is likely to follow a breakout above the $22 level.

Latest comments

Loading next article…
Risk Disclosure: Trading in financial instruments and/or cryptocurrencies involves high risks including the risk of losing some, or all, of your investment amount, and may not be suitable for all investors. Prices of cryptocurrencies are extremely volatile and may be affected by external factors such as financial, regulatory or political events. Trading on margin increases the financial risks.
Before deciding to trade in financial instrument or cryptocurrencies you should be fully informed of the risks and costs associated with trading the financial markets, carefully consider your investment objectives, level of experience, and risk appetite, and seek professional advice where needed.
Fusion Media would like to remind you that the data contained in this website is not necessarily real-time nor accurate. The data and prices on the website are not necessarily provided by any market or exchange, but may be provided by market makers, and so prices may not be accurate and may differ from the actual price at any given market, meaning prices are indicative and not appropriate for trading purposes. Fusion Media and any provider of the data contained in this website will not accept liability for any loss or damage as a result of your trading, or your reliance on the information contained within this website.
It is prohibited to use, store, reproduce, display, modify, transmit or distribute the data contained in this website without the explicit prior written permission of Fusion Media and/or the data provider. All intellectual property rights are reserved by the providers and/or the exchange providing the data contained in this website.
Fusion Media may be compensated by the advertisers that appear on the website, based on your interaction with the advertisements or advertisers.
© 2007-2025 - Fusion Media Limited. All Rights Reserved.