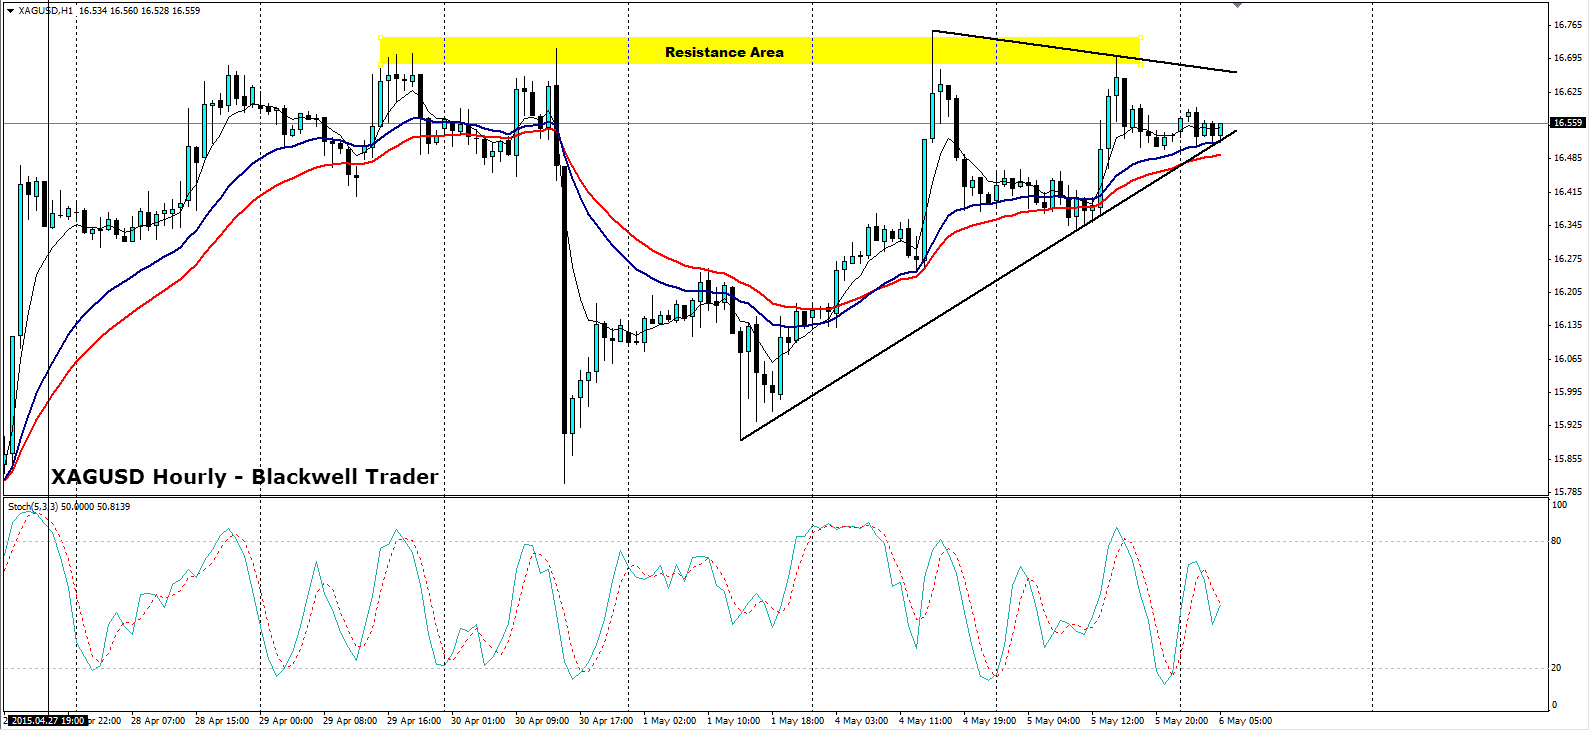
The past few days have seen silver consolidating sideways as it looks for some direction in the midst of a bevy of mixed US economic data. Despite attempting to push higher, silver has met some strong resistance at the 16.670 mark, and subsequently failed, pulling back to the supporting trend line. However, the pressure is building, and the charts are talking, as a wedge pattern starts to appear on H1. For now, silver appears content to consolidate ahead of a defined trend direction, but with the pending rising wedge, pressure for a breakout is increasing.

Looking at the technical indicators shows stochastics and RSI residing within neutral territory. MACD has flattened somewhat but still remains slightly bullish above the 0.00 level. Also, the 30-SMA is acting as a form of dynamic support/resistance and price action currently remains above that level. As price remains supported on the bullish trend line, expect to see the top of the wedge start to come under pressure over the next 24 hours.
To cement a move higher, the metal will need to surmount the resistance at 16.67, a break of which could see silver climbing strongly towards the 16.90-17.00 range. If the current, short term bullish run weakens, a breakout on the downside is a real possibility with support at 16.33 – 16.25, and 16.00 – 15.90 under risk.
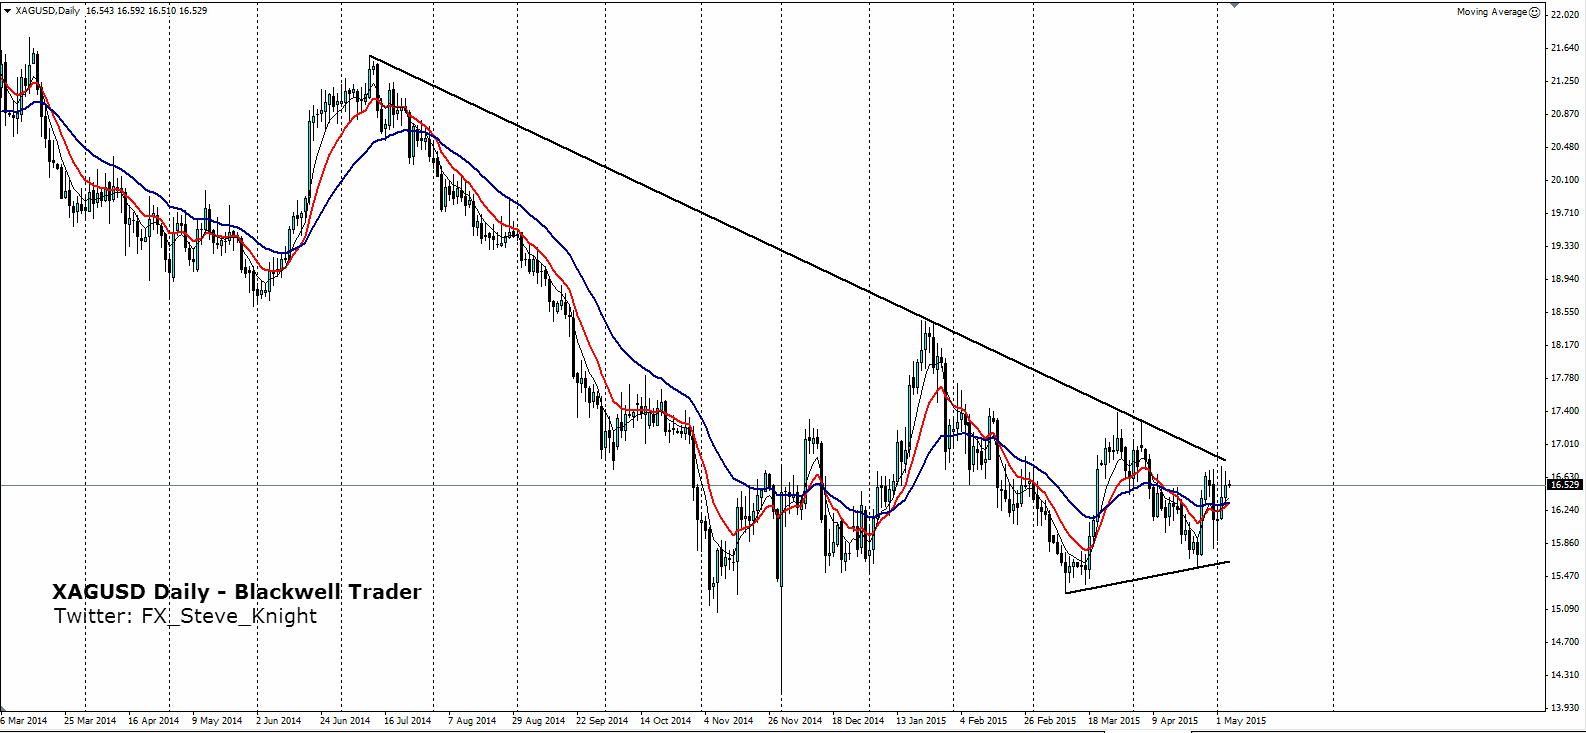
The daily chart confirms a definite, medium term bearish sentiment, but shows the wedge developing and pressure building for a breakout. Lately, there have also been some analysts suggesting that silver is long overdue in breaking the bearish trend, that has been in place since 2011. Ultimately, wedge and pennant patterns are difficult to predict, but considering that price action is being constrained within a steadily tightening pattern, a breakout is sure to arrive shortly.

