By Jesse Colombo
China cut interest rates last week and unveiled an extensive stimulus package to boost its struggling economy.
These announcements sparked a surge in commodities like gold, silver, and copper, bringing my bullish outlook on silver closer to fruition. I decided it was an opportune time for a quick update.
Let's start with silver’s daily chart. Since its peak in May, silver had been languishing for several months until it finally broke above a downtrend line that started in May, closing above it last Friday.
Silver's recent surch has taken it to its highest level since May. Silver now needs to close above its $32.50 resistance level with strong volume to confirm that the next leg of the bull market is underway.
Once silver clears the $32.50 resistance, it’s likely to surge toward $50 rapidly. I'm focusing on $50 as an intermediate-term target because it’s a significant psychological level and the peak reached during both the 1980 and 2011 rallies.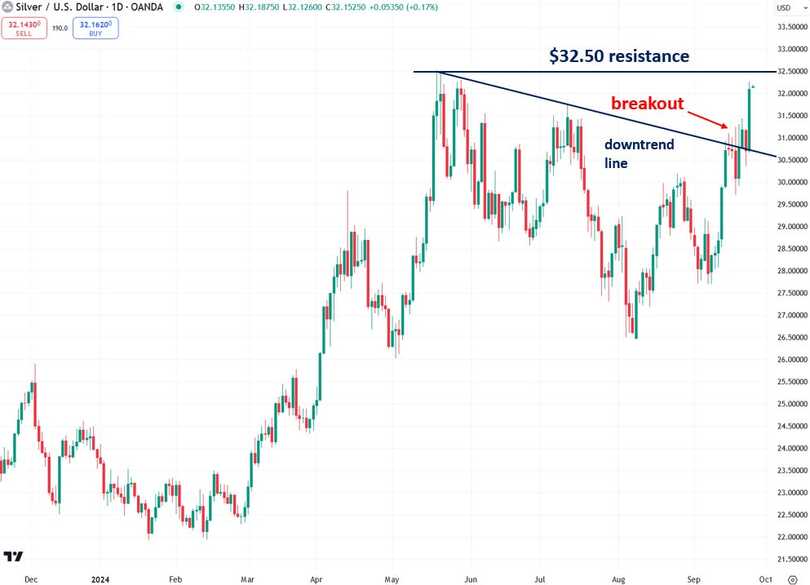
For further confirmation, I find it valuable to analyze silver priced in euros.
This method removes the impact of U.S. dollar fluctuations, offering a clearer view of silver's intrinsic strength or weakness.
Interestingly, silver priced in euros often respects round numbers like €26, €27, and €28, frequently establishing key support and resistance levels at these points.
These levels are worth monitoring closely—take a look for yourself.
Silver recently closed above both the €28 level and a downtrend line that started in May, marking a very bullish development.
The final hurdle is for silver to decisively close above the €30 level on high volume, which would be the signal that silver is ready to take off.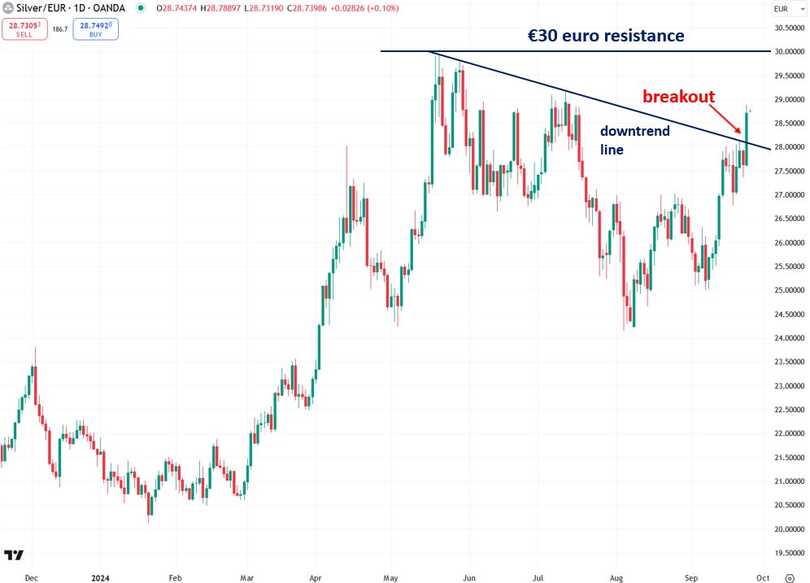
Silver mining stocks are also important to watch for confirming silver's price movements, as they often mirror investor sentiment toward the metal.
Global X Silver Miners ETF (NYSE:SIL), the most heavily traded silver mining stock ETF, has been stuck in a flat range since April. A strong, high-volume close above the $36 to $37 resistance zone would signal that both silver mining stocks and silver itself are poised for a significant breakout. After surging in recent days, SIL is very close to breaking out.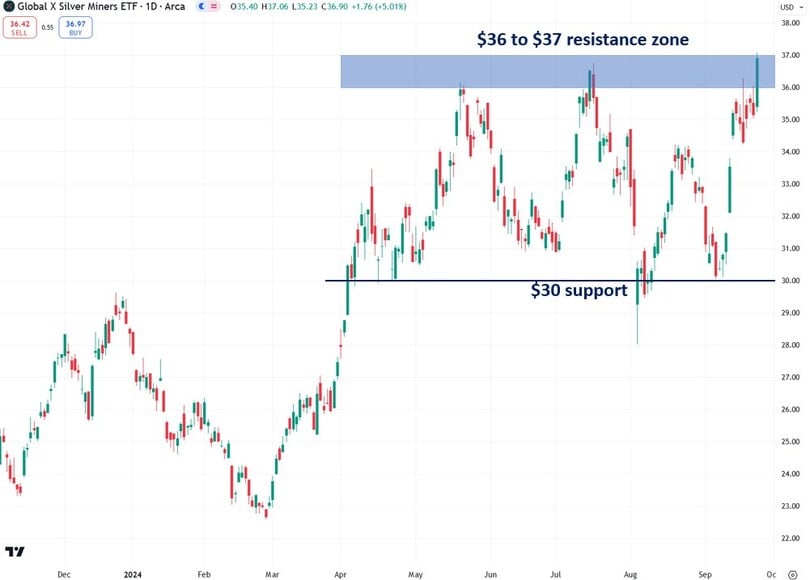
Similarly, the Amplify Junior Silver Miners ETF (NYSE:SILJ)—a key proxy for junior silver mining shares—has been range-bound for the past five months.
A decisive, high-volume close above the $13 to $13.50 resistance zone would indicate the start of a rally for both silver mining shares and silver itself.
After its sharp rise, SILJ is very close to breaking out.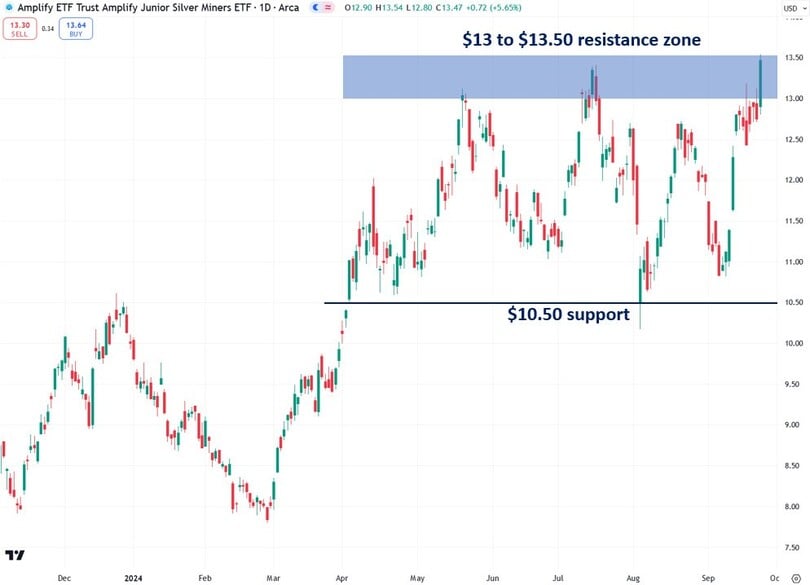
Gold, a major driver of silver prices, is generating a tailwind for silver after breaking through two key resistance levels in the past month and a half. 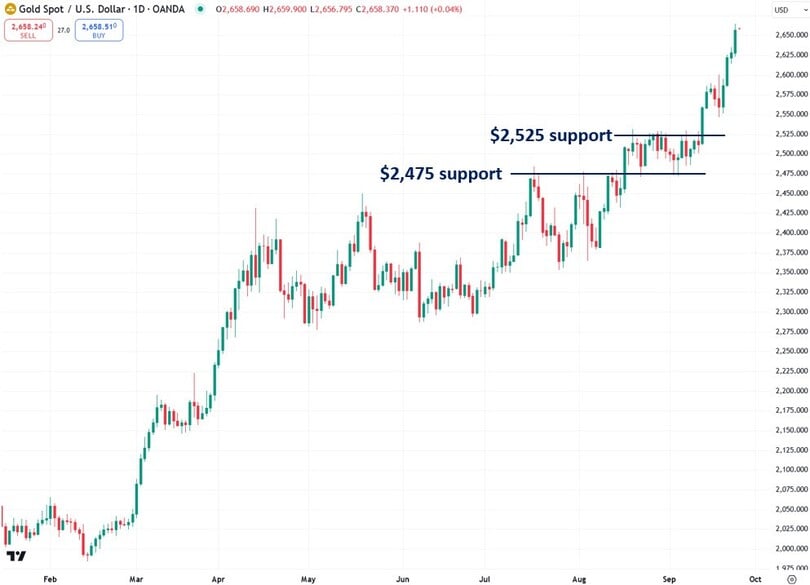
The gold-to-silver ratio is a valuable indicator for gauging silver’s price direction.
A double top chart pattern appears to have formed over the past two months, indicating a likely decline in the ratio.
This suggests that silver may soon start outperforming gold.
A close below the 83 to 84 support zone is key to confirming the start of a silver rally and its outperformance of gold.
Following silver’s strong performance, the ratio is starting to break below the critical 83 to 84 support zone—an unmistakable sign of strength for silver.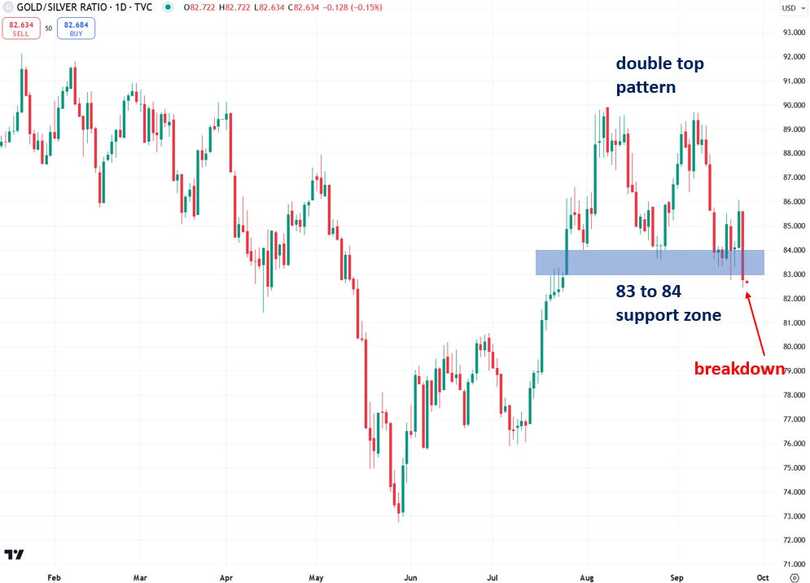
The price of copper is often an underappreciated factor in silver's performance.
Copper's decline over the past several months has dragged silver down with it, but the copper rebound I've been anticipating following a technical breakout should significantly strengthen silver's rally.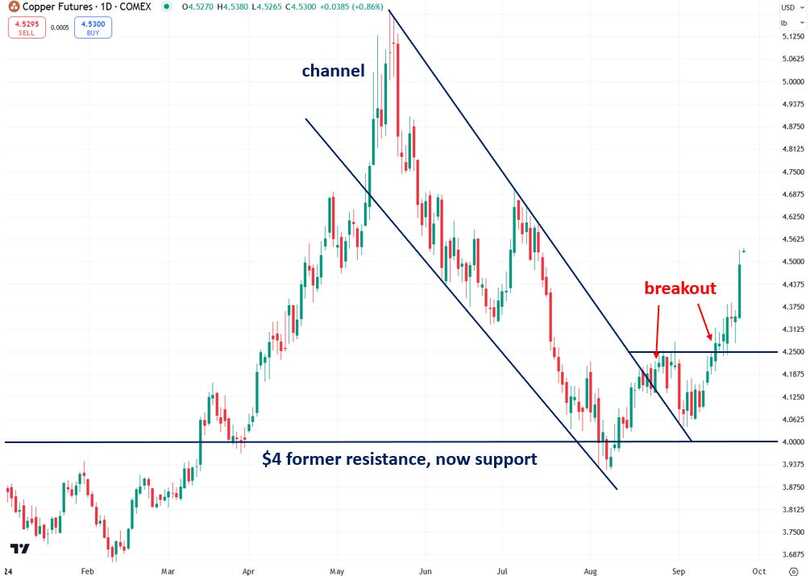
Another potential bullish factor for silver, gold, and copper is the prospect of a weaker U.S. dollar as the Federal Reserve begins its rate-cutting cycle.
Since commodities typically move inversely to the U.S. dollar, this is a critical development to monitor. The key level to watch is the 100 support on the U.S. Dollar Index.
A close below this level would strongly suggest a continued decline toward the 90 support level. At the time of writing, the U.S. Dollar Index is trading at 99.95.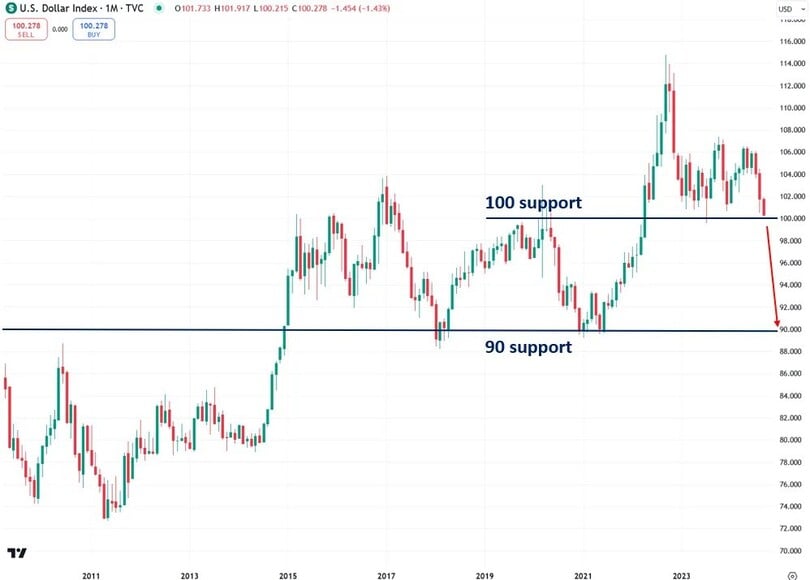
As silver nears a critical breakout, the convergence of multiple indicators signals a strong bullish outlook.
Recent economic developments, such as the U.S. rate cut and China's stimulus measures, have fueled momentum in commodities like silver, gold, and copper.
Silver's ability to break through key resistance levels, both in U.S. dollars and euros, alongside potential strength in silver mining stocks and a weakening U.S. dollar, reinforces the bullish outlook.
As the gold-to-silver ratio shows signs of decline and copper rebounds, the stage is set for silver to make significant gains, with $50 as a key intermediate-term target.
Investors should keep a close eye on these developments as silver's next major bull market may be just days away.