A tricky week that I did not handle well.
I’m still trading very very light but it seemed most of what I tried didn’t work and I ended the week down which does happen sometimes.
I’m not perfect and never profess to be. but I do pretty well mostly.
Anyhow, I’m trading small and even smaller until I get my rhythm back but markets are at a band of resistance and they are struggling to move past it for now and normally I’d have taken a short position in anticipation of a move lower but not the way my luck has gone this past week.
As for metals, they were setting up well for a breakout higher all week until Friday when they broke support solidly so let’s take a look at the charts and get a feel for support areas and what to look for next.
One housekeeping note though.
While I did have a bit of a tough week, we’ve had a few really nice weeks prior to this and my real-time service is open now for a few more days and is only $100 a month until the middle of June and you will learn a lot and make some good profits along the way.

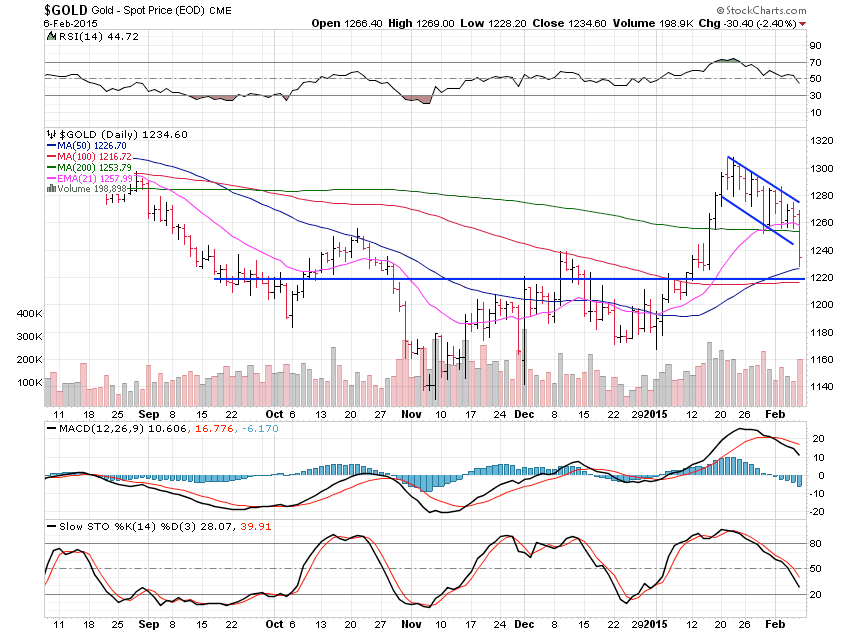
Gold lost a hefty 3.82% this past week after breaking the 200 day moving average hard Friday.
All week we were setting up a great descending channel that was set to break higher but subscribers had the obvious caveat that a break below the 200 day moving average would be a sell signal and annul the bullish pattern.
Friday saw heavy volume pushing gold lower and it’s already at the 50 day moving average support level which should hold for at least a few days.
From here to $1,220 is a support area and all we can do is wait to see what comes next.
It’s never a positive sign to break a bullish pattern and silver is telling us gold has further to fall.
A move under $1,220 will see me bring back talk of a move down to $1,000.
Below $1,220 support sits at $1,200 $1,180 then $1,160.
It’s hard to say much else right now until we get a few more days of trading to form something on the charts but lower looks to be a fairly safe call.

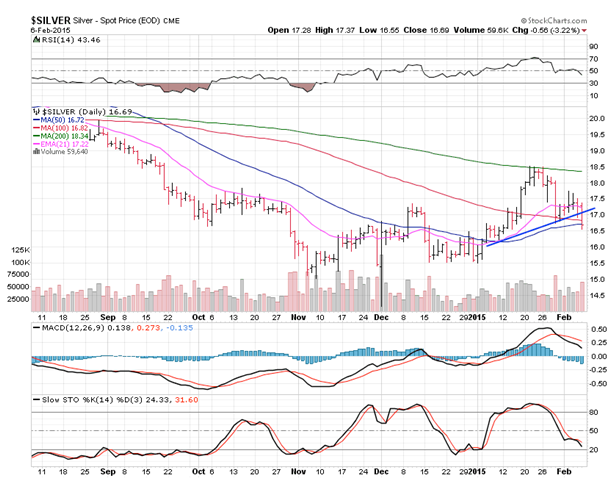
Silver lost 3.25% last week but mostly on Friday.
I kept talking to subscribers all week about the strange divergences between gold and silver.
Usually their charts match up pretty well but silver had a decidedly bearish chart while gold had a bullish chart and this was confusing.
Gold had been leading so I weighed in golds favour and remained bullish and even took a small long position in a miner ETF as it broke out Thursday but that opened with a gap lower Friday which saw me take my losses quickly before they grew and they would have.
So, it looks like silver is now leading gold once again and it is pointing to lower prices.
This slanting head and shoulders has now broken and points to a test of $15 in short order so gold is likely to follow and move back to test $1,180 once again.
There is some support every $0.50 below for silver until $15 but the power of this break tells me we shouldn’t take too long to hit $15.

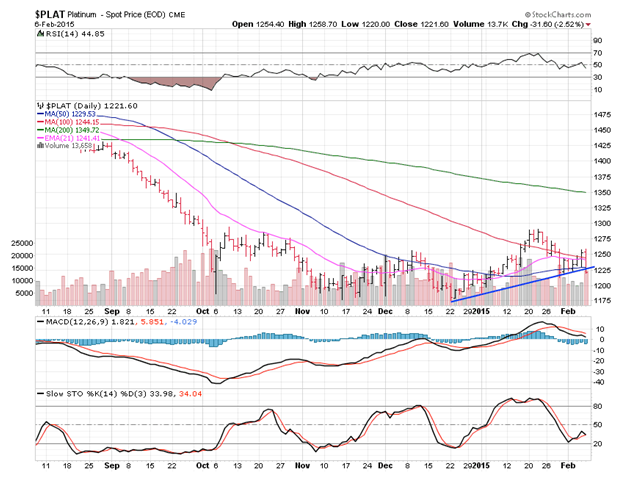
Platinum lost 1.54% over the last week and is just now breaking its slanting head and shoulders pattern which points to a test of $1,125 shortly.
Maybe a week or 2 tops before we see this low and then we see what forms next but the monthly chart is quite bearish and still points to a move to $800.
It’s too bad the metals have rolled back to a negative outlook so quickly but it happens and all we can do is adapt.
This game is not about being right, it’s about making money so I have to change my view as prices and action dictates.

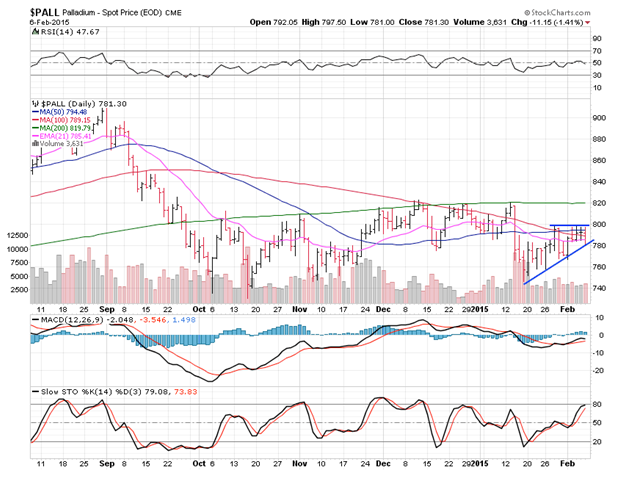
Palladium was the sole standout and gained 1.32% for the week.
That said, this triangle does point to lower pries and with the other metals weak, palladium won’t have a snowballs chance in Tahiti.
A break above $800 would be very positive but chances are much higher that we break the uptrend line around $780 and move back to $740.
I hope you have a very restful and relaxing weekend and remember to keep trading small if at all until we get better acting markets which could happen at anytime.