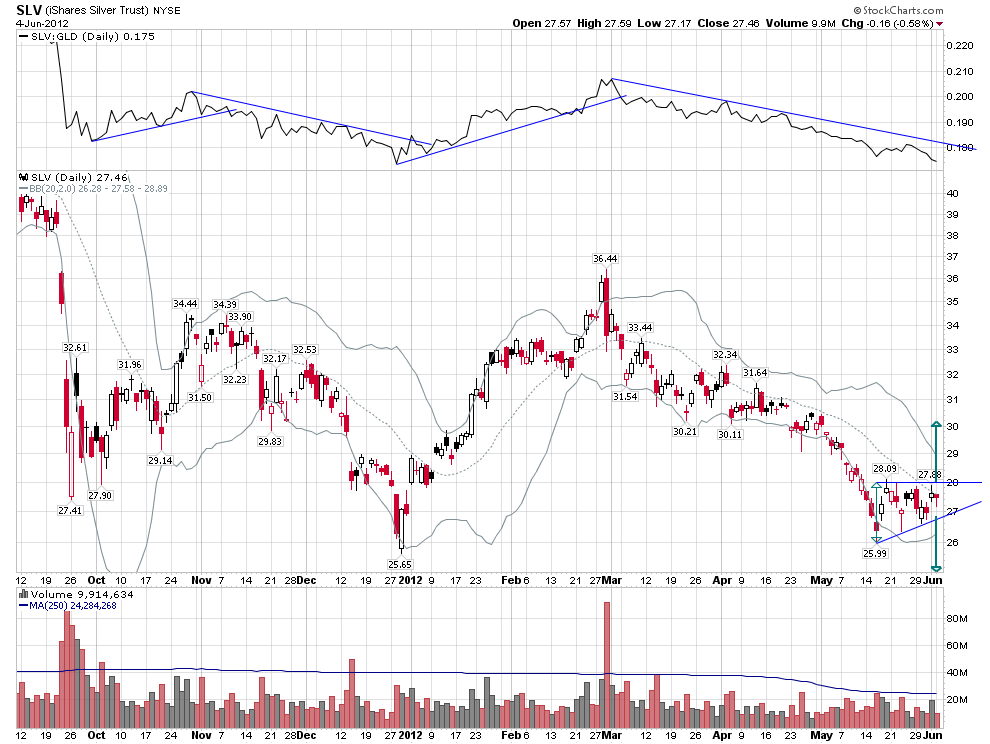
Since the start of a correction in Gold in September 2011 the iShares Silver Trust (SLV) followed all swings in the Gold ETF (GLD) only with the bigger relative amplitude, outperforming GLD on the upside and under-performing on the downside.
The relative strength of SLV against GLD is shown in the upper indicator window.
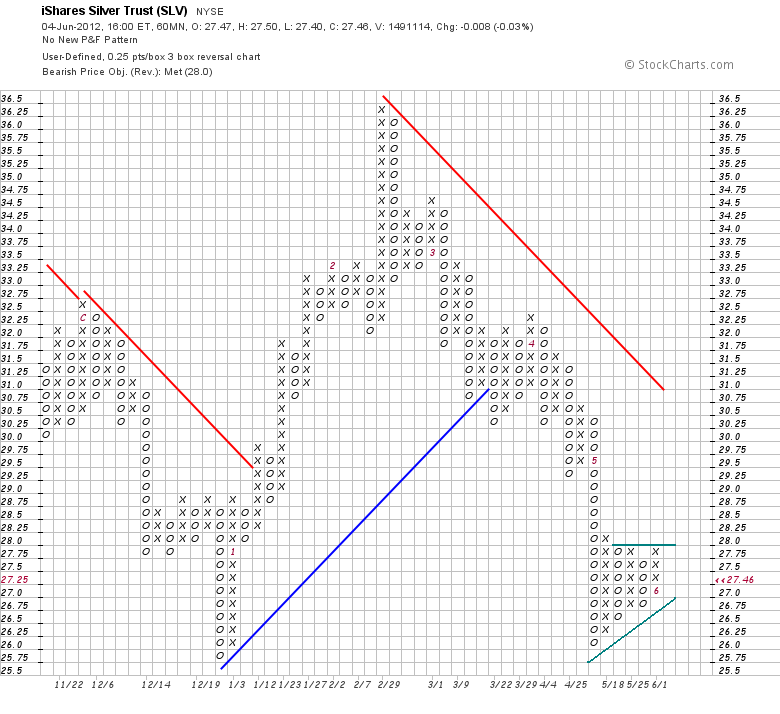
After the huge GLD surge on Friday it would be logical to expect SLV to follow based on the SLV performance of the last months. However, it looks like this time SLV has a mind of its own. SLV is continuing to vacillate in an ascending triangle from the second half of May and in no rush for the upward breakout.
Here we can dispute whether SLV is forming an ascending or symmetrical triangle. Personally, I am leaning toward an ascending triangle based on the short-term P&F chart with a box size of $0.25, which filters noise if the price move is less than $0.25.  According to Thomas Bulkowski ascending triangles break out to the upside 70% of the time, but since SLV is in the short-term downtrend from March, the odds of the downward breakout are still high. Contracting Bollinger Bands predict an inevitable thrust and an initial price target after this triangle breakout is $30 on the upside and $25 on the downside.
Disclaimer: I express only my personal opinion on the market and do not provide any trading or financial advice (see Disclaimer on my site).
- English (UK)
- English (India)
- English (Canada)
- English (Australia)
- English (South Africa)
- English (Philippines)
- English (Nigeria)
- Deutsch
- Español (España)
- Español (México)
- Français
- Italiano
- Nederlands
- Português (Portugal)
- Polski
- Português (Brasil)
- Русский
- Türkçe
- العربية
- Ελληνικά
- Svenska
- Suomi
- עברית
- 日本語
- 한국어
- 简体中文
- 繁體中文
- Bahasa Indonesia
- Bahasa Melayu
- ไทย
- Tiếng Việt
- हिंदी
Silver ETF Is Stuck In An Ascending Triangle
Published 06/05/2012, 01:38 AM
Updated 07/09/2023, 06:31 AM
Silver ETF Is Stuck In An Ascending Triangle
Latest comments
Loading next article…
Install Our App
Risk Disclosure: Trading in financial instruments and/or cryptocurrencies involves high risks including the risk of losing some, or all, of your investment amount, and may not be suitable for all investors. Prices of cryptocurrencies are extremely volatile and may be affected by external factors such as financial, regulatory or political events. Trading on margin increases the financial risks.
Before deciding to trade in financial instrument or cryptocurrencies you should be fully informed of the risks and costs associated with trading the financial markets, carefully consider your investment objectives, level of experience, and risk appetite, and seek professional advice where needed.
Fusion Media would like to remind you that the data contained in this website is not necessarily real-time nor accurate. The data and prices on the website are not necessarily provided by any market or exchange, but may be provided by market makers, and so prices may not be accurate and may differ from the actual price at any given market, meaning prices are indicative and not appropriate for trading purposes. Fusion Media and any provider of the data contained in this website will not accept liability for any loss or damage as a result of your trading, or your reliance on the information contained within this website.
It is prohibited to use, store, reproduce, display, modify, transmit or distribute the data contained in this website without the explicit prior written permission of Fusion Media and/or the data provider. All intellectual property rights are reserved by the providers and/or the exchange providing the data contained in this website.
Fusion Media may be compensated by the advertisers that appear on the website, based on your interaction with the advertisements or advertisers.
© 2007-2025 - Fusion Media Limited. All Rights Reserved.
