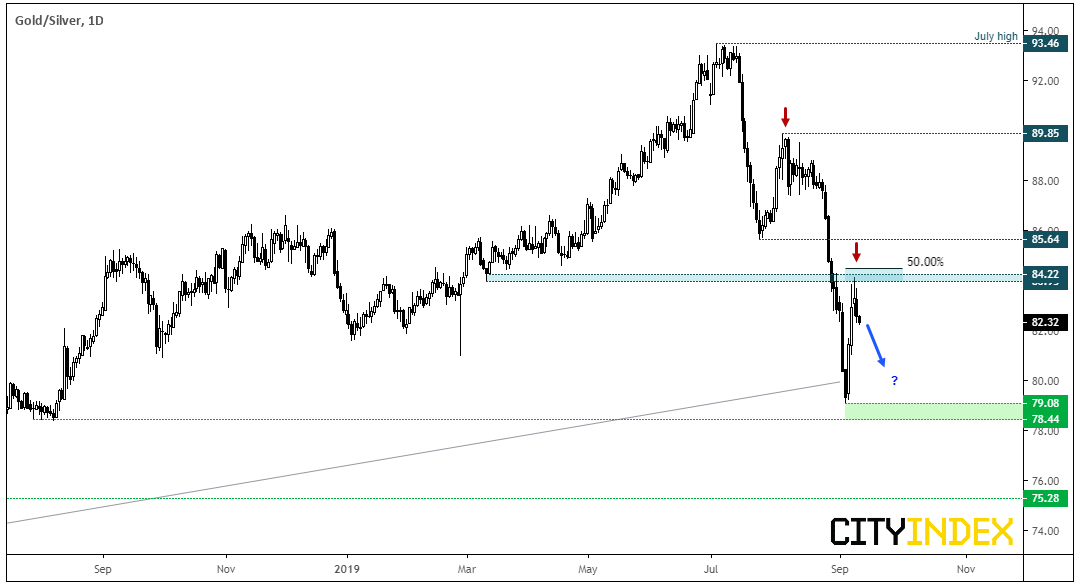
The gold:silver ratio is paused at a level of resistance for a potential pairs trade, while the underlying markets also test pivotal levels.

We can see on the daily chart that momentum has remained mostly bearish since the July high, although prices have retested a prior level of support. A spinning top doji formed below the 50% retracement level and yesterday’s bearish close suggest momentum is starting to turn lower once more. While the ratio remains below the resistance zone, we expect silver to outperform gold over the near-term (even if both underlying markets break lower as part of a correction).
Given the reversal of risk sentiment, the current environment is less supportive of silver and gold. We’re therefore looking at a bearish ratio over the near-term setup only. Further out, we expect the demand for gold and silver to return.

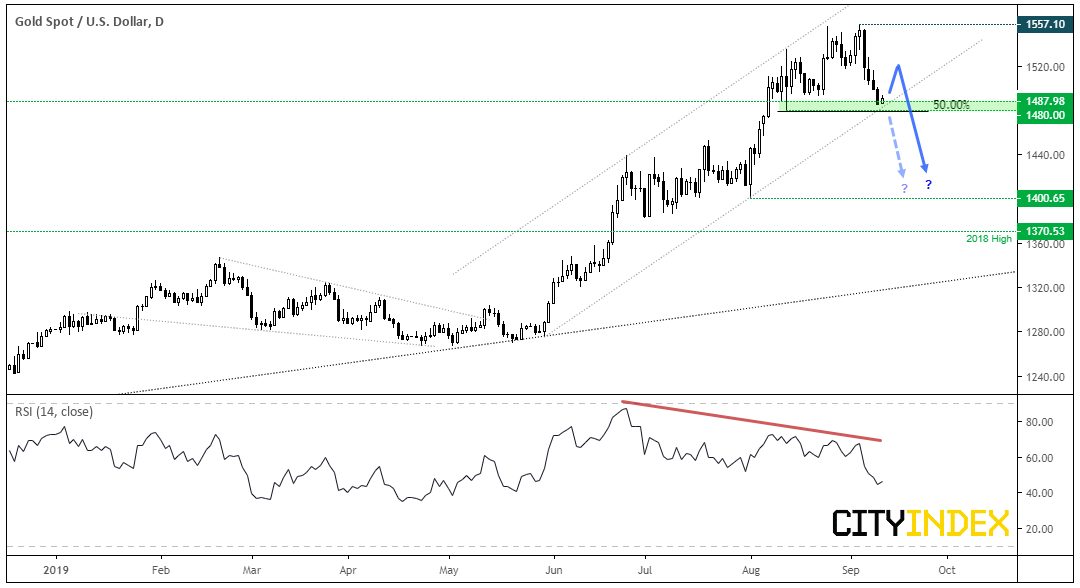
We’ve been noting for several weeks in the weekly COT report that gold has been screaming over-extension to the upside. While new highs are certainly possible (given the strength of its breakout to multi-year highs) a correction almost feels overdue. So, it’s interesting to note that gold sits on a pivotal level of support.
Gold prices remain in a bullish channel on the daily chart, although its retracement is testing its lower bounds of the channel, the 50% retracement level and a zone of support between $1480-88. There’s also the bearish divergence with RSI to consider, which shows bullish momentum is waning within the channel.
- Given the strength of the decline from $1557, a clear break of the channel and $1480 could suggest that a deeper correction is underway.
- However, given the levels of support nearby, a minor bounce could materialize and form a lower high, ahead of breaking below $1480.
- If we see bullish momentum return from current levels, we can reconsider the potential for it to re-test (or even break above) recent highs.

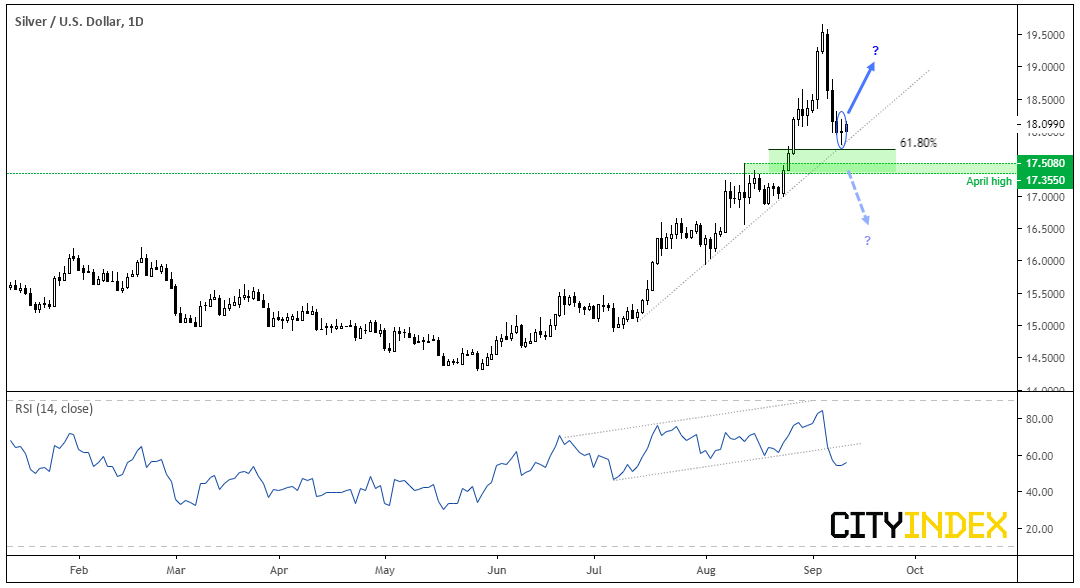
The daily structure for silver appears the more bullish over the near-term than gold. While we’ve clearly seen a deep retracement, a Rikshaw Man doji has formed at the bullish trendline and the 61.8% Fibonacci level. There’s also no bearish divergence with RSI like that seen on gold. Granted, RSI has broken down through it’s own channel, but there are more levels of support nearby to cushion a fall from a technical standpoint.
- If prices remain above the trendline, we remain bullish over the near-term and suspect it could outperform gold, even if they were to bounce in tandem.
- If prices break below 17.35/50, a deeper retracement appears to be in the cards.
- Even if silver breaks down, silver could still outperform gold as part of a gold/silver spread trade
