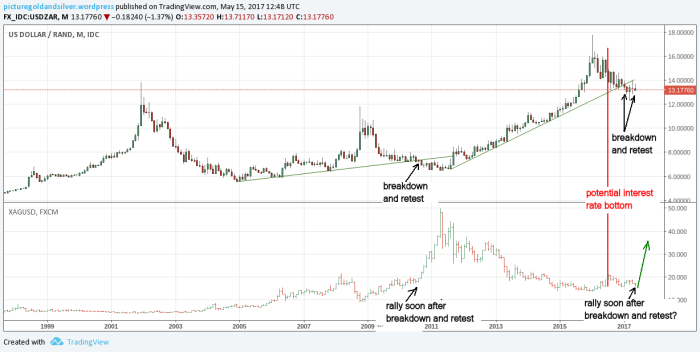
The silver price and the US Dollar/South African Rand exchange rate (USD/ZAR) have a very interesting relationship that goes back a long way.
In the long run, the two move in opposite directions. When the USD/ZAR rate moves up, the price of silver moves down, and vice versa. Furthermore, when USD/ZAR is making a top, then a bottom in silver is normally very close (before or after USD/ZAR peaks).
Due to the nature of this relationship, the USD/ZAR chart is often a leading indicator for a silver bottom as well as a silver rally.
Both the South African rand and silver are depressed by lower interest rates. In other words, when interest rates are low, then the market is putting a low value on the South African rand — and silver. Interestingly enough, South Africa was recently downgraded to junk status.
Interest rates are close to all-time lows; therefore, silver and the rand is near all-time lows (in real terms). Note that when the South African rand is low, it means a high USD/ZAR rate.
I have written about this peculiar relationship between interest rates and silver here. Below is a comparison between silver prices and the USD/ZAR.

On the USD/ZAR chart, I have drawn two support lines (2005 to around 2011 and 2011 to 2017). Around August of 2010, the USD/ZAR rate broke below the support line (with a retest occurring soon after), from where it continued lower.
Silver started an impressive rally soon after, which led to a retest of the 1980 high, around $50.
We now have a similar situation, since the USD/ZAR rate broke below the support line around the beginning of this year. It has just completed a retest of that breakdown, by touching the support line. It now appears that we are likely to see a massive silver rally similar to that of 2010/2011.
