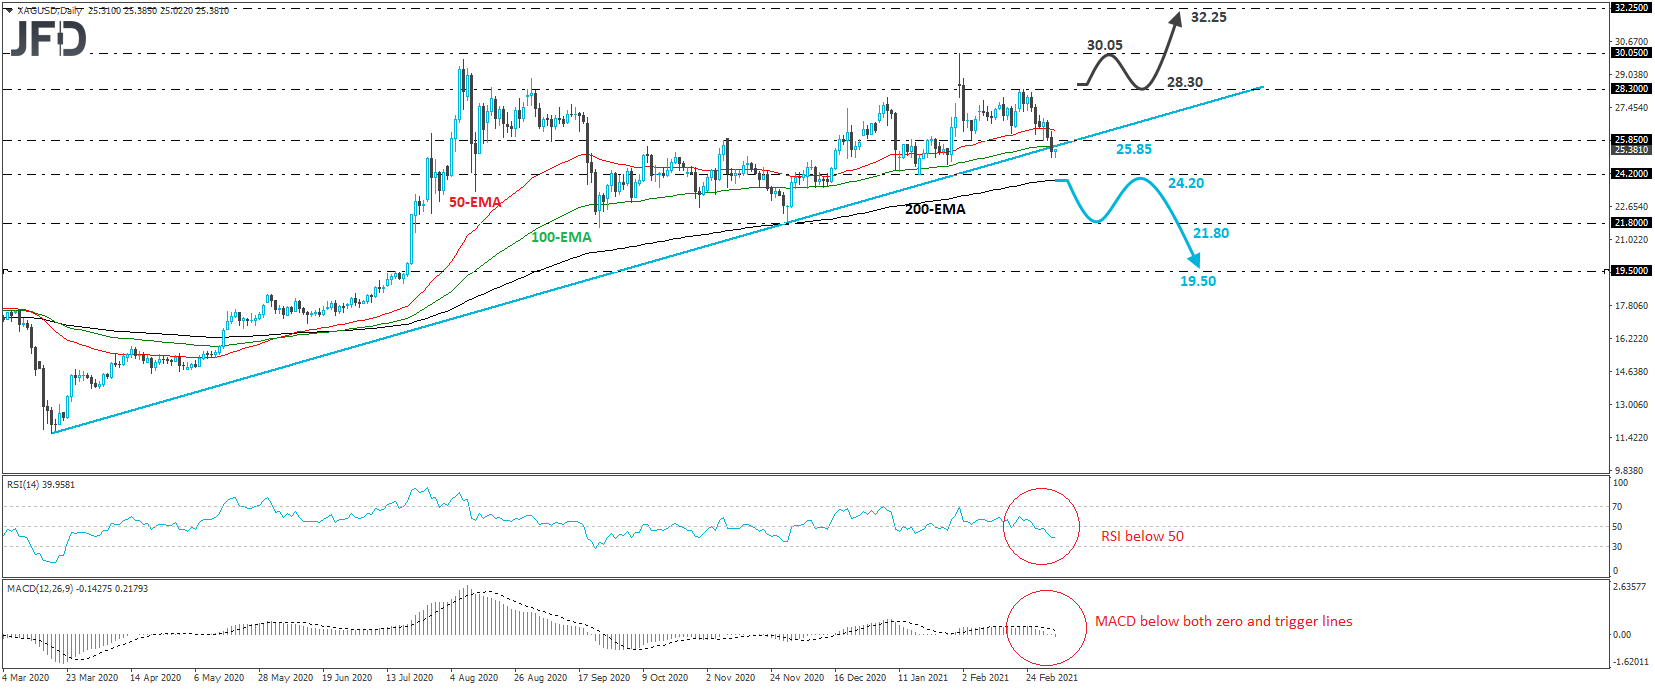
XAG/USD traded lower on Thursday, breaking below the upside support line drawn from the low of Mar. 18. In our view, this cancels the bullish case, but in order to start examining the case of a trend reversal, we would like to see a clear dip below 24.20, which is the low of Jan. 18. For now, we will stay sidelined.
In our view, a dip below 24.20 could complete the reversal, as it would confirm a forthcoming lower low on the daily chart.
Initially, the bears may get encouraged to push the battle towards the 21.80 territory, defined as a support by the low of the Nov. 30, the break of which could trigger declines towards the 19.50 area, marked by the inside swing high of July 15.
Looking at our daily oscillators, we see that the RSI fell below its 50 line, while the MACD, already below its trigger line, has touched its toe below zero. Both indicators suggest that the white metal has started gaining downside speed, increasing the likelihood for further declines, and perhaps a dip below 24.20 soon.
In order to start examining the bullish case again, we would like to see a strong rebound back above 28.30, a resistance marked by the highs of Feb. 22 and 23.
The price would already be back above the aforementioned upside line, and may climb to the 30.05 obstacle, marked by the peak of Feb. 1. A break above that barrier will take the metal into territories last seen back in the beginning of 2013 and may set the stage for advances towards the 32.25 area, near the peak of Jan. 30, 2013.
