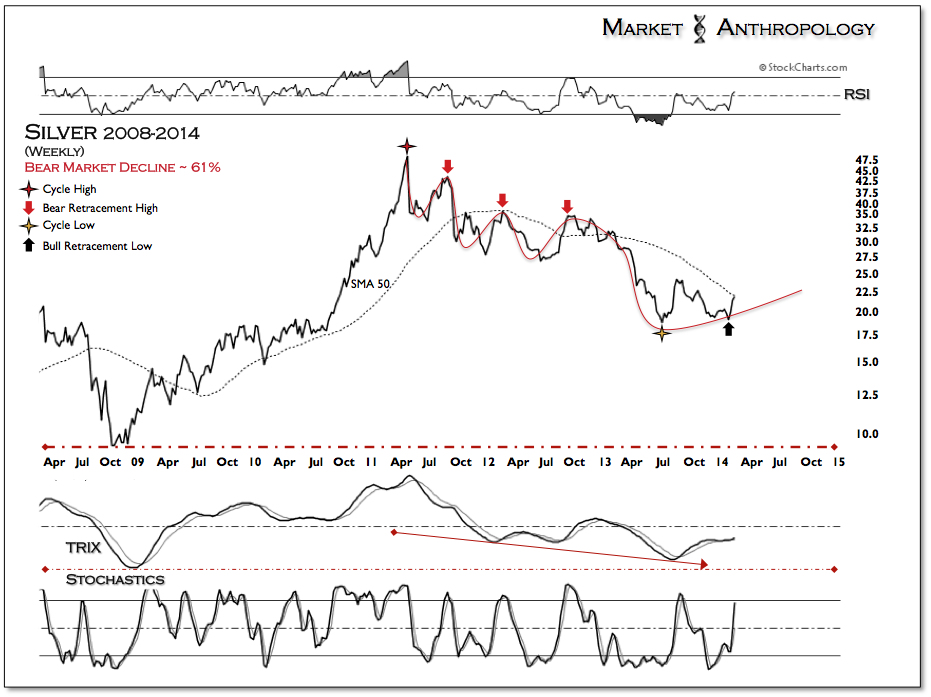
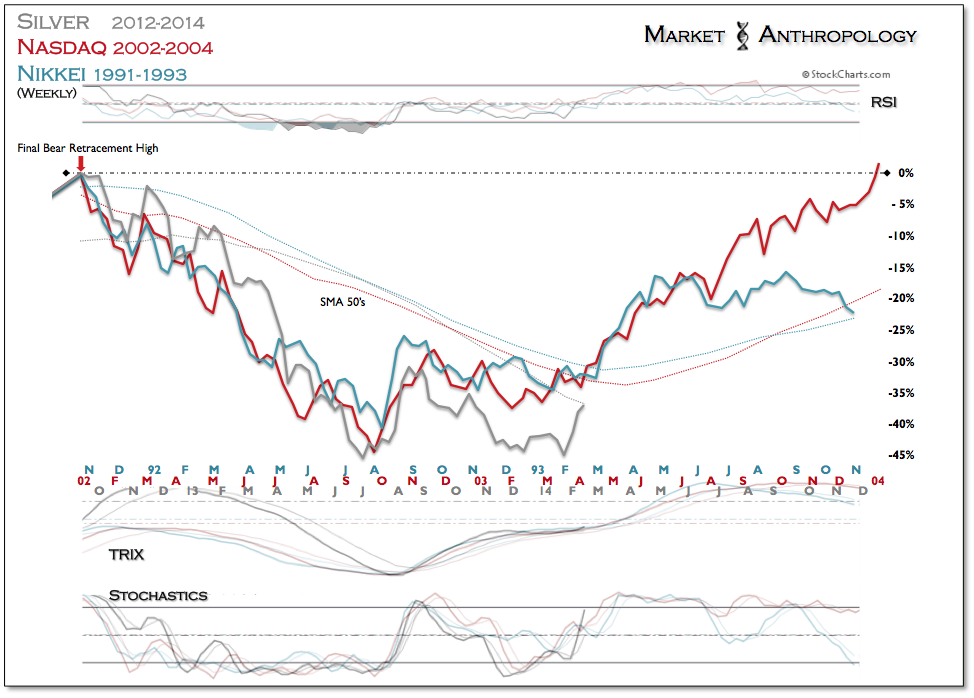
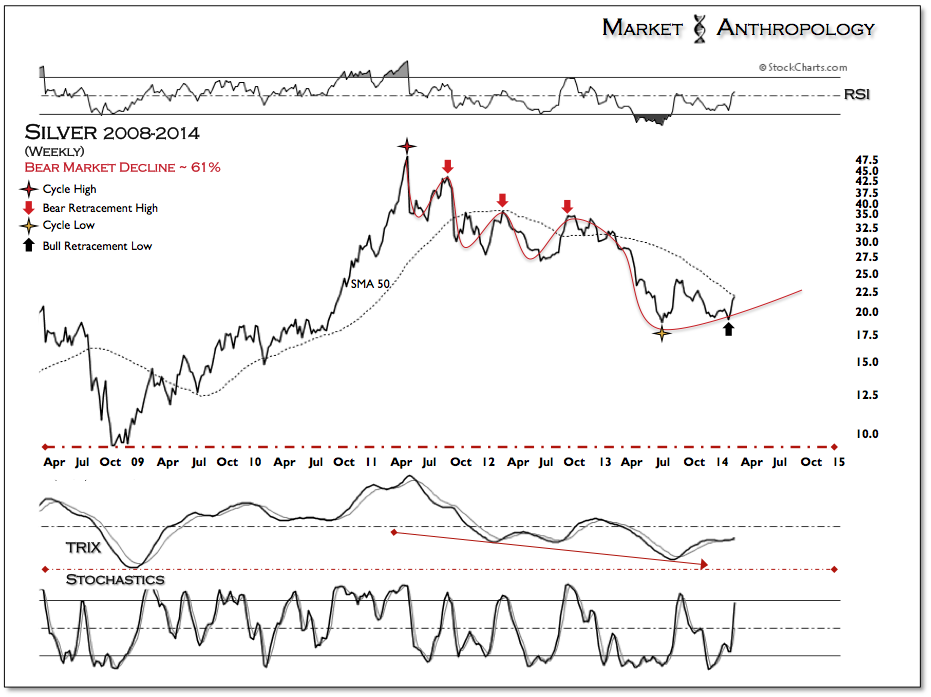
If you had asked us in the spring of 2011 how severe of a decline in spot prices we expected in silver, we would have based an educated perspective on the previous cycle breakdown for the Nasdaq bubble that measured to roughly an 80% fall from high to low. This is basically what we had presented in our comparative research on silver leading up to the top.
If you had asked us the same question in the summer of 2012 with a year of hindsight from the initial breakdown, we would have tightened our handicap to roughly a 60% fall from high to low - based on how silver was tracking closer with the Nikkei's bust profile from the early 1990's. While major asset downtrends do unfurl along similar lines, we have found greater intuition in contrasting the respective nuances to help sharpen our future expectations with potential outcomes and outliers.
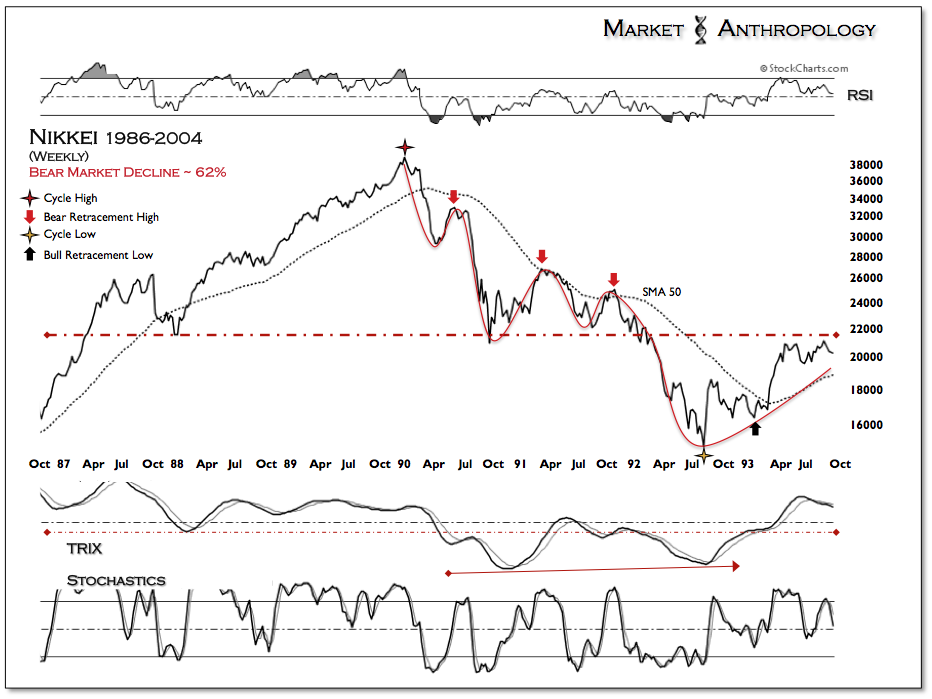
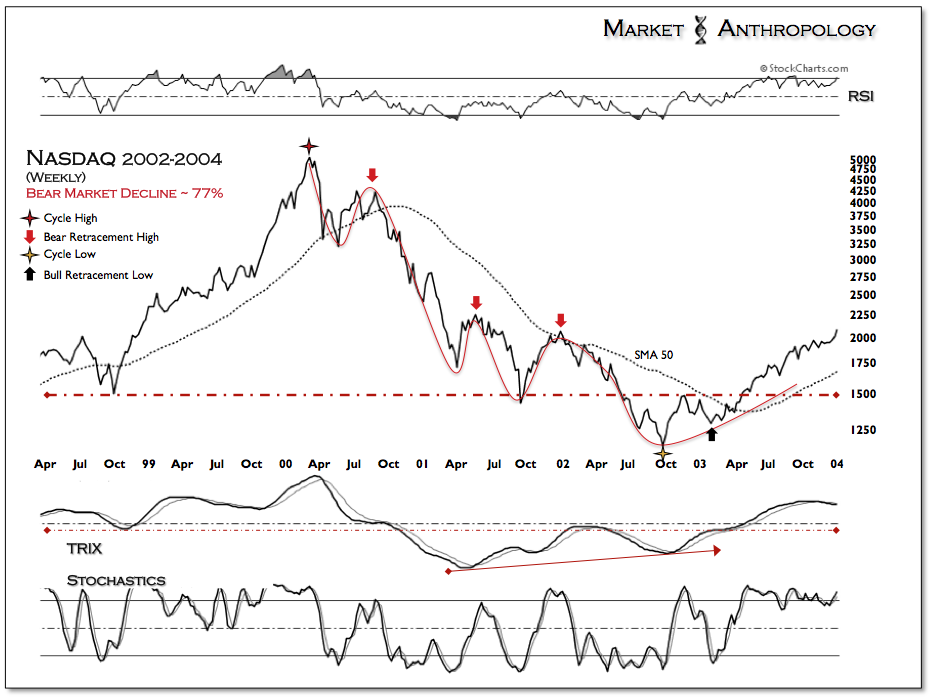
Over the next year - from our shift in comparative profiles in June of 2012, we relied on the Nikkei's final retracement bounce and decline to help situate our respective market postures in silver and the broader precious metals sector. This combinatorial and comparative approach greatly assisted us as the sector navigated through another QE salvo from the Fed and through the final retracement high for silver and gold that fall. Coming through the first half of 2013 we maintained our bearish posture on the sector as silver pivoted along a similar performance arc with the historic Nikkei profile.
While each market will invariably present its own unique footprints guided by both their inherent and external motivations, in the end the psychological reflexes that drive these major markets break and bounce along very similar folds. In the end when all the dust had settled, spot prices in silver had declined ~ 61% from their late April 2011 high to its low at the end of June last year.
So with almost three years of daylight now shown down on the corrective profiles of silver and gold, what do we see from a comparative perspective with these other major asset trends that might help us handicap the next stage for the precious metals sector?
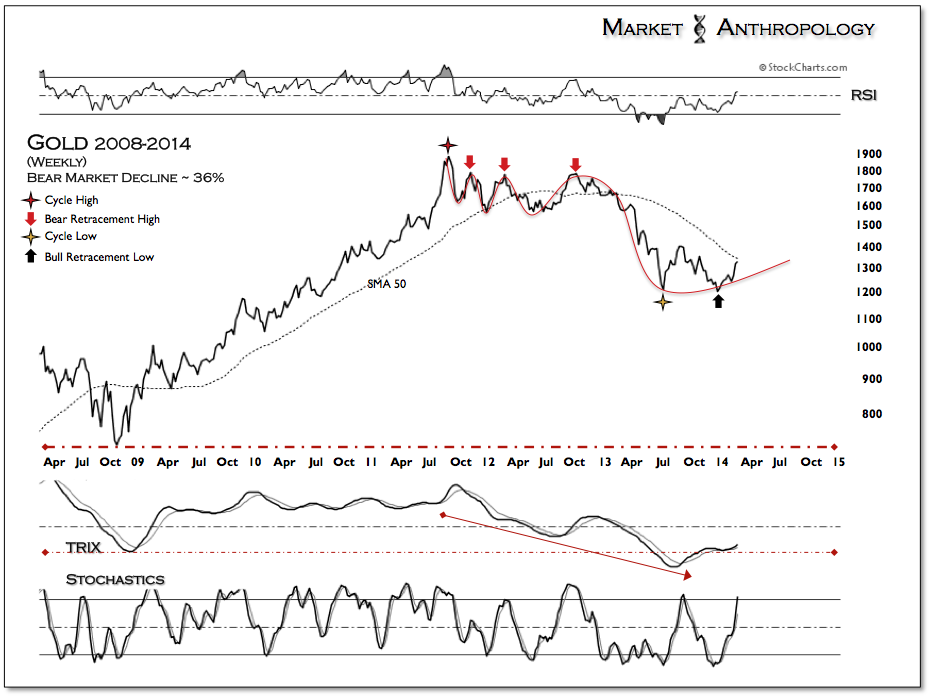
- From a simpleton technical point of view, both silver and gold have made higher highs and higher lows - despite going through a major bear market.
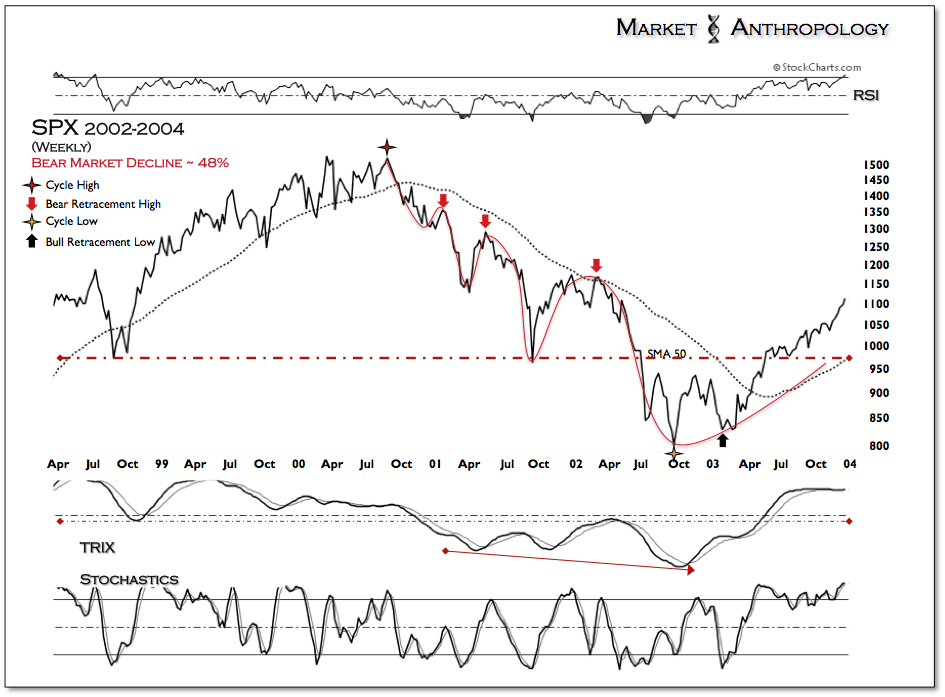
If you had asked us in the spring of 2011 if we thought the underlying technical condition of the secular bull would survive the coming bear, we would have likely said no. This is in stark contrast to the historic Nasdaq, Nikkei and even the SPX (circa 2000-2002), that all made lower lows during their respective bear markets - which expressed pronounced negative momentum divergences going forward in their long-term profiles. Both the Nasdaq and the SPX eclipsed the cyclical bear market lows of the LTCM crisis in 1998 - and the Nikkei as well broke the lows from the 1987 crash.
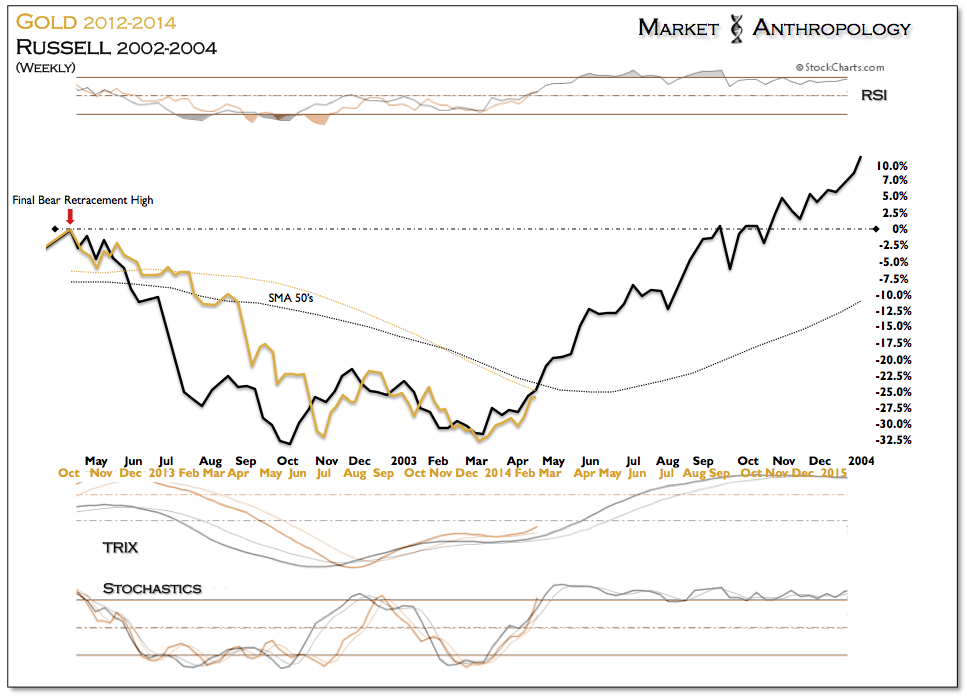
One sector from the 2000-2002 downturn that came away in the best technical condition from both a structural and momentum point-of-view was the Russell 2000 small cap index. Hindsight 20/20, the 2000-2002 bear was just a corrective leg in the continuation of trend higher in the RUT that has widely outperformed both the SPX and NDX ever since the bear market lows in 2002.
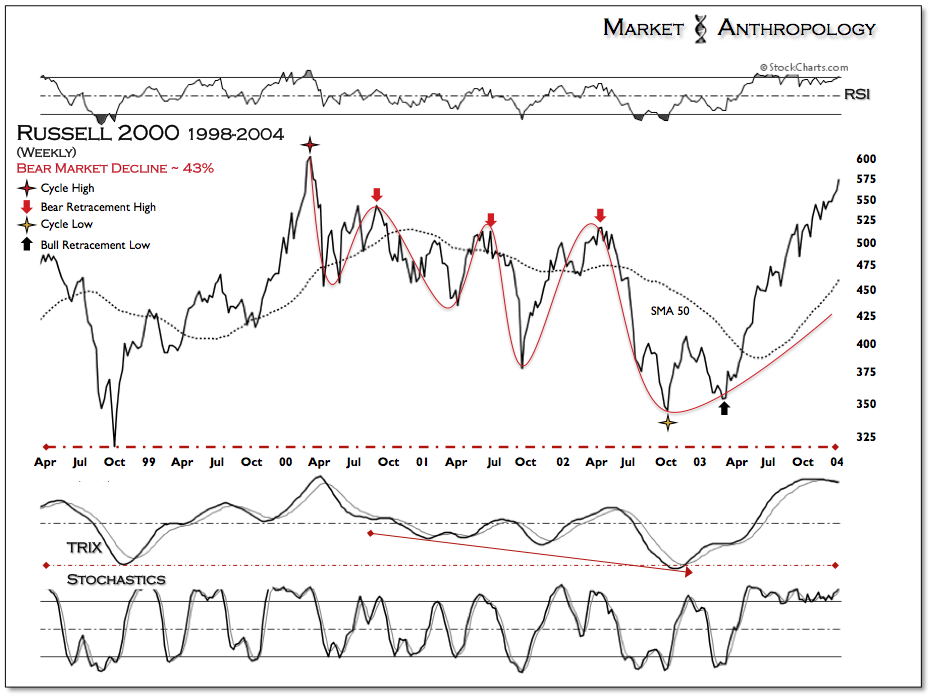
Technically speaking, from a structural and momentum perspective, the lay of the land and performance of the Russell fits closest with what transpired in both silver and gold - despite the spectrum of performance (Ag -61% & Au -36%) the 2000-2002 RUT (-43%) sits directly between.
From a performance perspective, gold has closely followed the final retracement decline of the historic RUT and currently sits directly beneath its 50 week sma. For the RUT - and likely gold and silver as well, the moving average serves as the literal divide from breaking out of its extensive base and byways and turning back up the interchange that we now cautiously suspect leads back to the bull market highway.


