Silver – Pinbar False Break Played Out Well
Silver has been stuck in a very contrived range since Jan. 26th confined within a $1.50 range for a long time. However, on Thursday last week a Pinbar False Break formed off the range low which was actually ideal, as it broke the range low, but then created a false break and eventually a pinbar.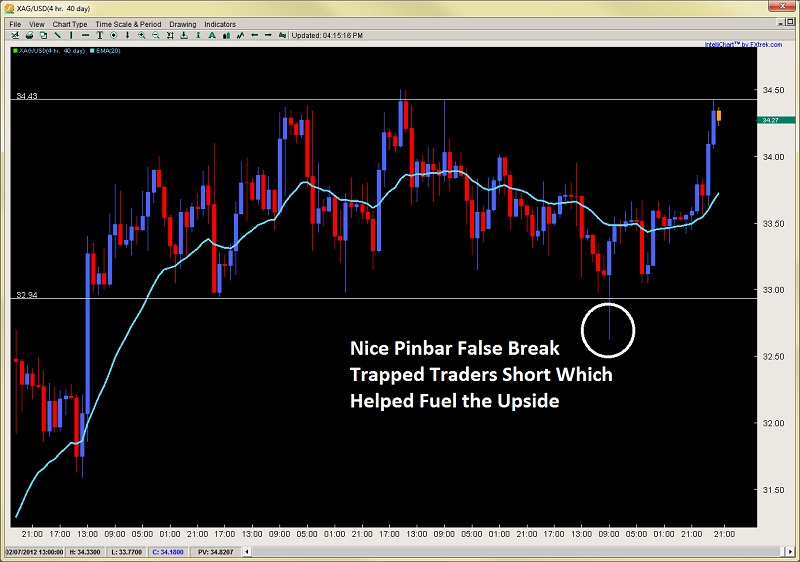 XAG/USD" title="XAG/USD" width="800" height="562">This trapped intraday traders who went short on the break so to cover their shorts, they had to exit via a buy order. The pair climbed just above $33.50, then pulled back to the open of the pinbar which gave a great trigger. Many of my price action traders got in on this one having less than a $.50 stop and an almost 2.5:1 R:R ratio with the range high just getting hit so well done to them.
Price action has been impulsive on this latest run up, so look for a breakout-retest setup should the highs be broken strongly.
AUD/USD – Possible Breakout – Retest
Since the 9th of this month, the Aussie has been playing ping pong between 1.0815 and 1.0648 with piercings beyond this level, but no closes. The price action rejections off the north side of these two levels have been much more violent and consistent but the longs off the lower end of the range haven’t been slouches either, just not as impulsive.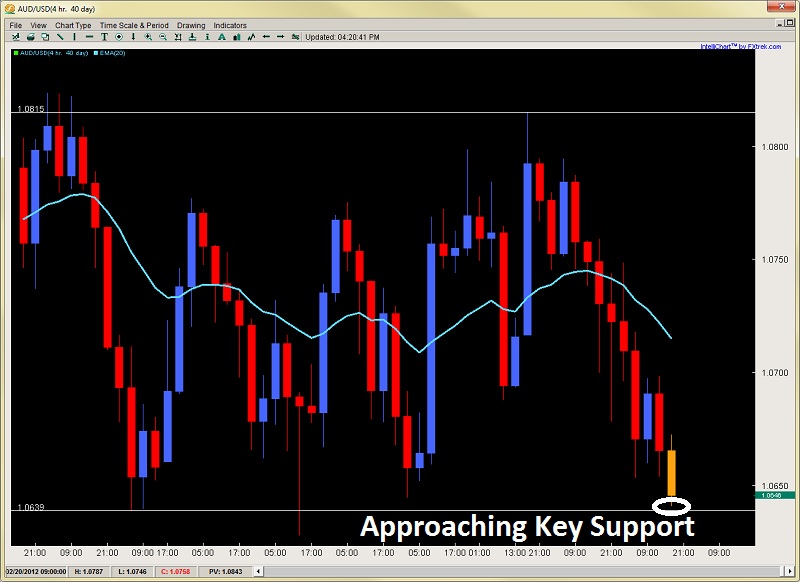 AUD/USD" title="AUD/USD" width="800" height="532">As we speak, price is possibly breaking out of the range so traders should watch for a breakout-retest setup. Should we get a really bearish close here, especially below the range support, then we can see price unwinding to 1.0573 in a hurry. To be honest, we would be impressed if this level holds as the price action has been quite impulsive with only one blue candle in the last 8, so only 4hrs of buying in the last 32 which leans toward a break of the range. But there may be enough buyers there to hold the line.
Should the buyers hold the line, then watch for a possible pinbar setup after the close of the candle and look to target 1.0750 and 1.0800 for a nice 3:1 R:R play.
ANSWERS TO YESTERDAYS POST
As promised, I would post the next 3 bars in the chart, along with the 4 patterns I spotted from yesterday’s chart. Many of you came up with some nice responses and spotted some really good patterns in the price action so well done to all.
Here is the chart below again to refresh your memory with the last candle shown. Now that you have seen the chart again above, here are the four patterns I spotted along with the strategy I formed form these patterns.
- Every time a bull candle forms, the following candle is a bear candle
- For the last 3 bull candles that formed, none of them took out the prior bear candles high
- Out of all the 6 bull candles that formed, only once did the following bear candle break the high of the prior bull candle (1 did technically by a half a pip)
- Using the information above, if I had sold on the open of the first candle after a bull candle, I could have placed a stop 3pips above the high of the prior bull candle, and targeted a 3:1 Reward to Risk Ratio every time which would have played out.
Based on the four patterns above, on the close of this bull candle, I will short on open, and since the bull candle has not taken out the prior candles high, I will place my stop 3pips above the bull candles high, with a 3x target.
Here is how it played out in my simulator This was a trade I took in my trade simulator over the weekend as I was doing practice recognizing price action patterns and behaviors. It is very easy to get caught up in the patterns we already trade and this can lead to us often forgetting to look for new patterns, or spot behaviors that repeat themselves. I had one system setup available, but because I wanted to hunt for other possibilities, I looked for patterns which gave me an opportunity to trade this better than my system had allowed.
By constantly looking for new patterns, we will notice things we never saw before and this can lead to new insights and abilities in reading price action so hopefully this makes sense and you found some benefit in this.
One more small point. Imagine trading a 5min chart or less. Ask yourself honestly, would you have had time to spot this, process all the information and data, and been able to form a strategy around it? One of you came up with a pretty close scenario, but nobody found a tighter stop, nor was even able to isolate the other patterns.
I’ve been doing this a long time, and am constantly analyzing price action for patterns, not just systems, but behaviors that are happening in the market real time which can often afford me unique opportunities outside my systems entries.
My guess is most people would not have been able to spot this trading real time, in a live market if they were trading off of a 5min, 1min or tick chart, let alone formed a strategy based on this. For the really experienced, possibly and probably, but if you are still in the learning process, just think about this, and how much more powerful your trading would be if you had the time to spot these unique opportunities, that can come up on a daily basis.
Food for thought, but I hope you enjoyed this exercise in pattern recognition, and I thank you all for participating.