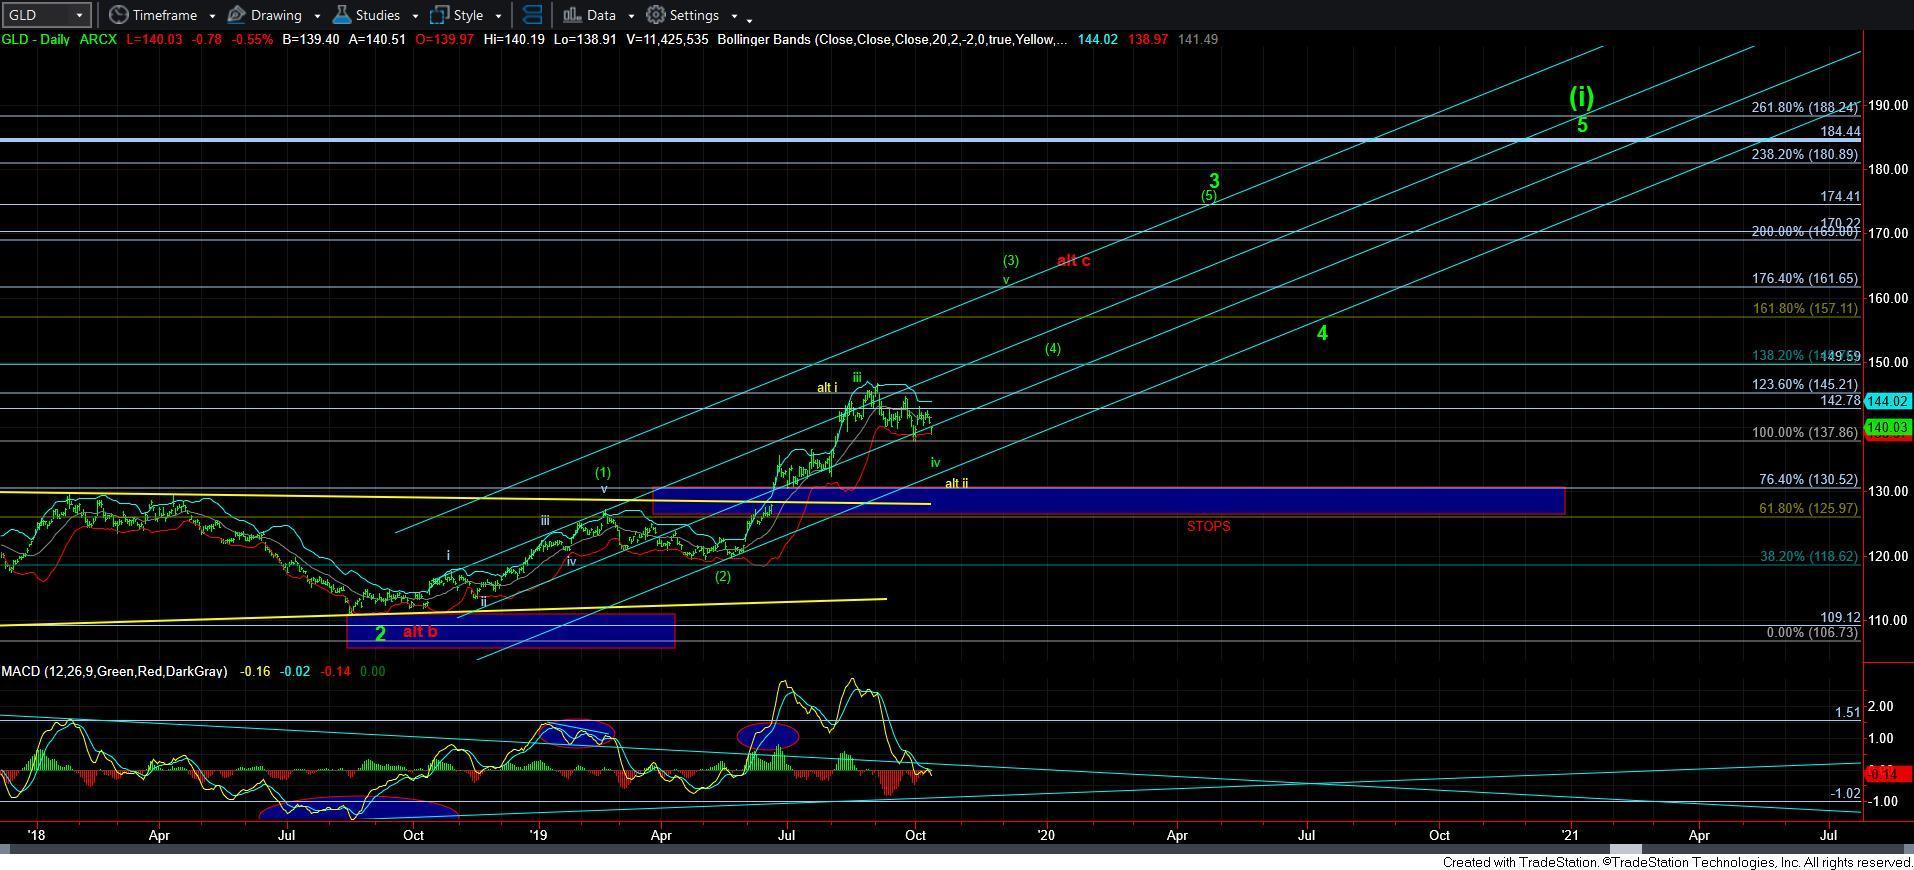
Originally published on Sat. Oct. 12 for our ElliottWaveTrader members: While we have been tracking the metals market for the next rally set-up, we have seen some signs that the market may attempt to begin that rally sooner rather than later. However, I have to be honest in noting that I am seeing more signs that lower levels for gold may still be struck before we are ready for that rally.
So, as I have been saying for the last few weeks, I am going to still treat the market as likely needing more of a corrective downside structure before we begin the next rally phase—until the market is able to prove otherwise.
I'll begine with the chart that probably provides me the clearest perspective of further weakness in the coming weeks. I have referred to this chart several times in the past due to the textbook pattern is has been providing to us, as well as an illustration of the type of move I expect in the heart of a 3rd wave in some of the other mining stocks we are tracking. The chart I speak of is Royal Gold (NASDAQ:RGLD).
While the move in wave (3) on this chart is what I expect to see in the Newmont Goldcorp (NYSE:NEM), VanEck Vectors Gold Miners ETF (NYSE:GDX) and VanEck Vectors Junior Gold Miners (NYSE:GDXJ) next, I have to note that the RGLD chart rather clearly pointis to a c-wave lower in this current pullback before we are ready to embark on the next major rally phase. It's quite compelling in its simplicity and standard structure.
When I review all the other charts, they all line up reasonably well within this perspective of a needing more corrective downside. While a bounce can still take hold before this happens, I think the preponderance of the evidence suggests that lower levels can still be seen in the complex before what I am counting as a 2nd wave pullback completes.
The one standout to me right now is that the gold price per ounce (via SPDR® Gold Shares (NYSE:GLD)) may actually have already completed its pullback for what I am counting as a wave iv in that chart.
Yet, as I have said many times before, if the market can stage a strong impulsive rally over the coming week or two, followed by a corrective 2nd wave pullback, with a rally back over the high struck in the initial rally, then I will clearly abandon expectations of further corrective action, and immediately turn uber-bullish. But, until such time, I am still going to maintain expectations of lower levels to be seen before this current pullback/consolidation completes.

