Monitoring purposes GOLD: Gold ETF GLD long at 173.59 on 9/21/11
Long-Term Trend monitor purposes: Flat

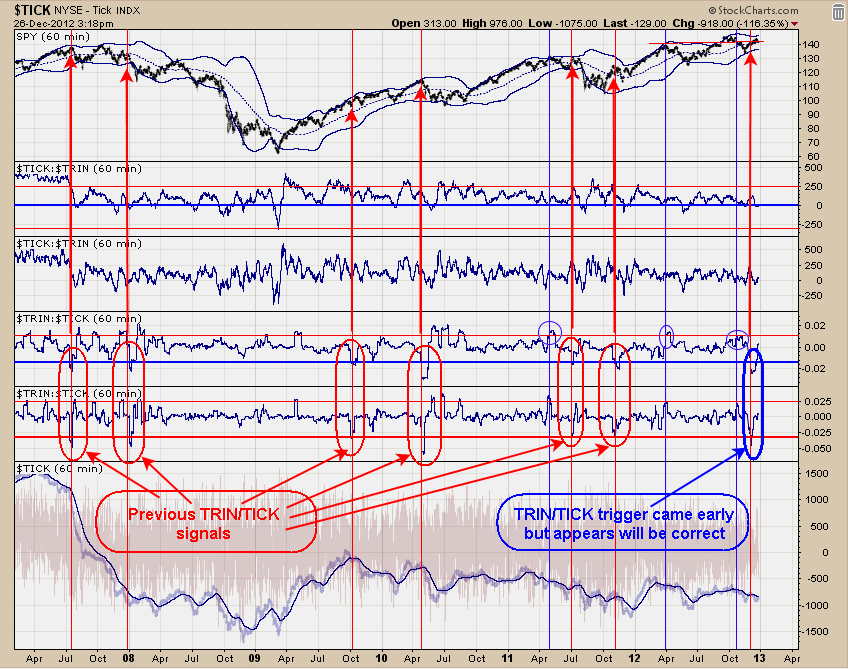
The second and third windows up from the bottom is the TRIN/TICK ratios that are on two different moving averages. When both TRIN/TICK ratios hit below their extremes and turn up imply the market is about to turn down. Previous signals have been circled in red and date back to 2007 so you can see how they performed after a signal was triggered.
Most cases these signals came near the high and we where expecting something similar here. We zoned in closer and the actual signal date came in on December 1. All but one of the signals (the one in October 2009 didn’t work that great) produced a decent decline and we are expecting a decent decline here. 
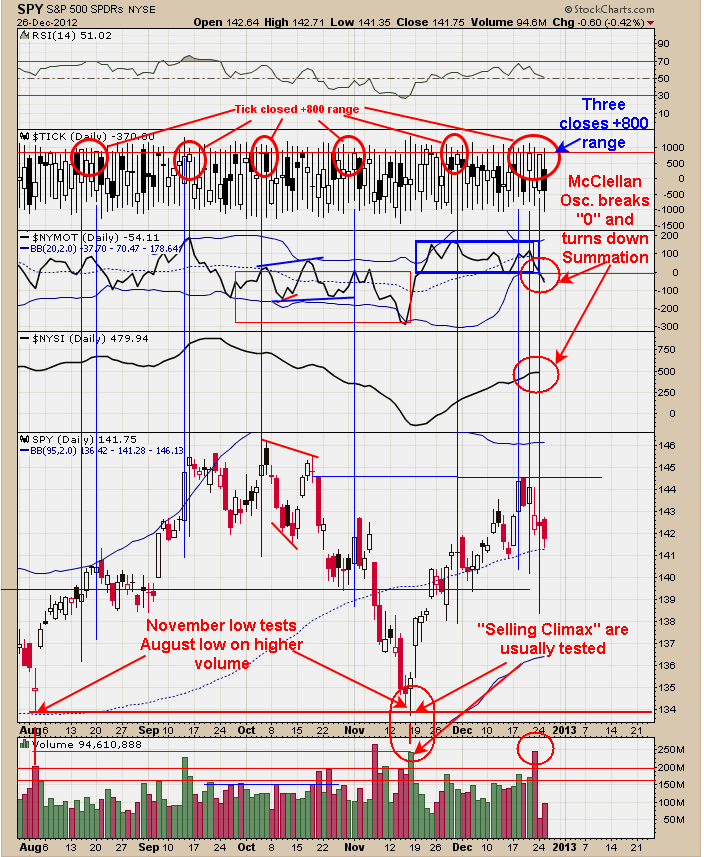
The blue vertical lines represent times when the Ticks close near +800 range. Decent consolidation appeared when there where two tick closing near +800 in the same vicinity which appeared at the mid-August high and the top that came in September. Currently we have three ticks closing in the +800 range that appeared in the last five trading days and suggests a decent decline is in the making. Also the McClellan Oscillator closed below the “0” line yesterday and has pushed further into negative territory today and suggesting momentum is picking up to the downside.
Last Friday’s break to the downside showed an increase in volume which implied the trend turned down. Notice that the November low (near 134) tested the August low on higher volume and suggested the November low will be tested again and remains our longer term target. In general the McClellan Oscillator will remain below “0” line as the downtrend is enforce. 
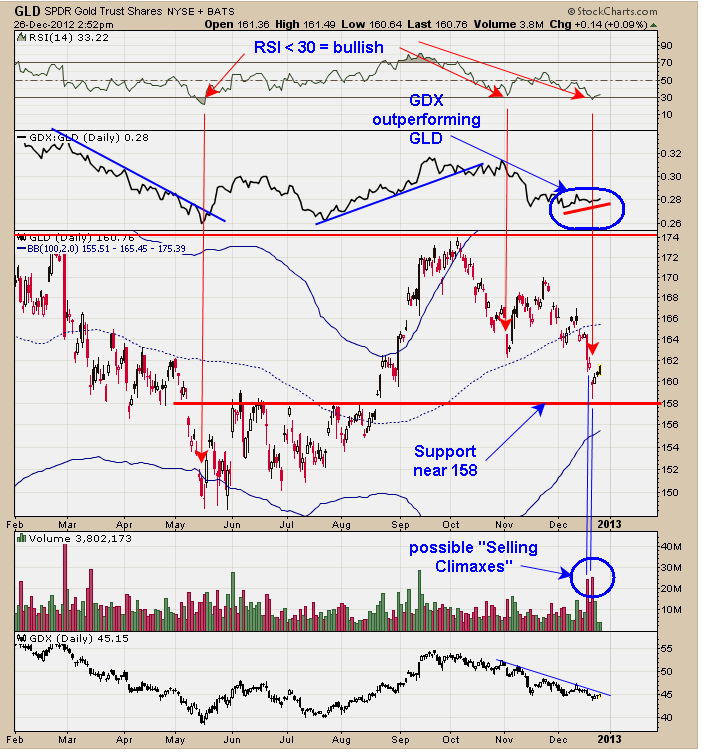
Above is the ETF for Gold which is GLD. The recent report for the Commitment of Traders show that the Commercials (smart money) are still relative high on their short position but have decreased there shorts over the last couple of weeks and heading to a neutral stance. Strong support lies near 158 range on GLD which is the gold highs set back in June and July. There have been a couple of big volume spikes over the last several days and could be a “Selling Climaxes” which imply exhaustion to the downside. Normally there are tests of the “Selling Climaxes” lows before the bottom process is complete and therefore will need more time.
The RSI for GLD hit below 30 and a bullish sign. The GDX/GLD ratio has been moving higher over the last month and Gld has been moving down, showing gold stocks are outperforming gold and a bullish sign for both. If this bullish GDX/GLD ratio persist when gold finds its next low will imply a very bullish condition for gold stocks.
In conclusion, GLD has been producing “Selling Climaxes” near support at 158 and suggests the 158 range may find the low after a test on lighter volume. COT for Commercials shorts is still high and needs more time to work off and suggests the bottom could be a could be a week or more away and probably in time for the test of the “Selling Climaxes” lows. Picture is looking bullish but more time is needed.
Long NG at 5.14 on 10/8/12. Long GDX 58.65 on 12/6/11. Sold SLV at 30.24 on 12/19/12 = gain 2.6%; Long SLV at 29.48 on 10/20/11. Long GDXJ average 29.75 on 4/27/12. Long GLD at 173.59 on 9/21/11. Long BRD at 1.67 on 8/3/11. Long YNGFF .44 on 7/6/11. Long EGI at 2.16, on 6/30/11. Long GLD at 147.14 on 6/29/11; stop 170 hit = gain 15.5% . Long KBX at 1.13 on 11/9/10. Long LODE at 2.85 on 1/21/11. Long UEXCF at 2.07 on 1/5/11. We will hold as our core position in AUQ, CDE and KGC because in the longer term view these issues will head much higher. Holding CDE (average long at 27.7. Long cryxf at 1.82 on 2/5/08. KGC long at 6.07. Long AUQ average of 8.25.
