🎈 Up Big Today: Find today's biggest gainers (some over 50%!) with our free screenerTry Stock Screener

Signs Of Green Shoots In China?

Published 04/30/2012, 03:31 AM
Updated 07/09/2023, 06:31 AM
HG
-
COMIN
-

In the past few weeks, the markets have shown concern that China may be on the verge of a hard landing. My reading of the charts indicate that those concerns are starting to recede and there may be signs of "green shoots" out of China. Bear in mind the following two caveats to my analysis:

  • "Green shoots" are fragile and can easily be trampled underfoot; and
  • "Green shoots" are indications of stabilization, not signs that a roaring bull market is about to begin.
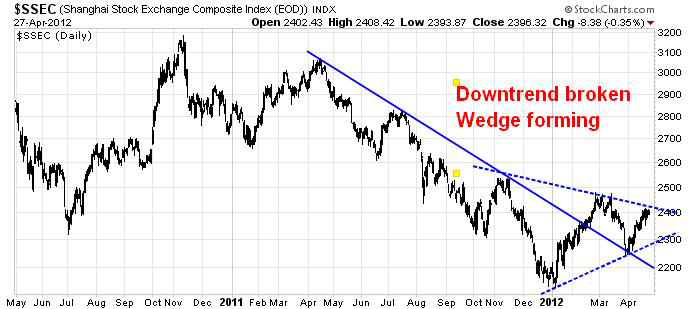
First, a chart of the Shanghai Composite shows that the index has rallied through an intermediate term downtrend (solid line) and that market is in the process of a sideways consolidation. In fact, it could be argued that the Shanghai Composite is starting to form a wedge pattern (dotted lines). Depending on which way the pattern resolves itself, it could point to the future trajectory of Chinese growth.
SSEC CHART
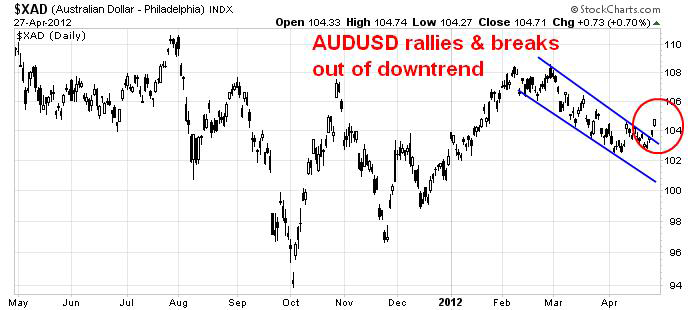
China is an enormous consumer of commodities. In this post (see Time to take some risk off the table), I pointed to the dismal behavior of commodity sensitive currencies as a sign for caution. Now, commodity sensitive currencies such as the Australian Dollar has rallied through its downtrend. A period of sideways consolidation is likely at this point.
XAD CHART
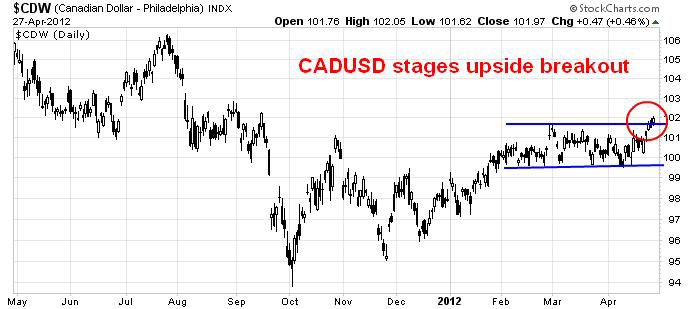
The Canadian Dollar, which is another commodity sensitive currency whose economy has greater leveraged to the American economy than the Australian economy, recently staged an upside breakout from a trading range.
CDW CHART
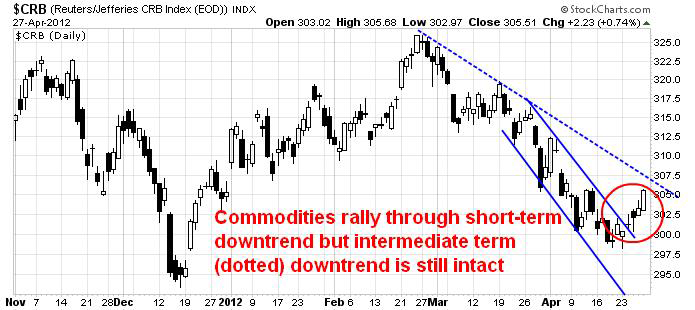
Commodity prices are also showing a tender green shoot, though that one is far more fragile. The CRB Index below shows that commodity prices have staged an upside breakout from a short-term downtrend (solid line), but the longer intermediate term downtrend (dotted line) remains intact.
CRB CHART
The liquidity weighted CRB Index is more heavily weighted towards the energy complex. A look at the equal-weighted CRB Index, called the Continuous Commodity Index or CCI, shows that the CCI has staged an upside breakout through the intermediate downtrend. The most likely scenario is that commodity prices undergo a period of sideways consolidation.
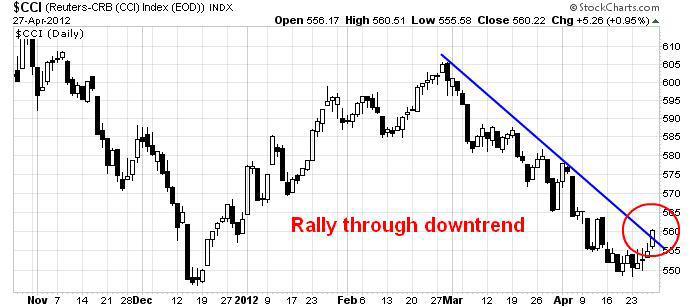
CCI CHART
To be sure, these "green shoots" are early signs of recovery which can easily be trampled. The strength in commodity prices may be a false start, as Izzy at FT Alphaville pointed out that it could be just more inventory accumulation and not the result of actual physical demand.

Constructive on China
My current framework for the analysis of the global outlook is to examine the Three Axis of Growth, namely the United States, Europe and China. For now, I believe that the message of the markets from China has changed from bearish to a fragile stabilization. No doubt the aforementioned markets will retrace some of their gains, but chances are good that the risks of a hard landing are receding.


Latest comments

Loading next article…
Risk Disclosure: Trading in financial instruments and/or cryptocurrencies involves high risks including the risk of losing some, or all, of your investment amount, and may not be suitable for all investors. Prices of cryptocurrencies are extremely volatile and may be affected by external factors such as financial, regulatory or political events. Trading on margin increases the financial risks.
Before deciding to trade in financial instrument or cryptocurrencies you should be fully informed of the risks and costs associated with trading the financial markets, carefully consider your investment objectives, level of experience, and risk appetite, and seek professional advice where needed.
Fusion Media would like to remind you that the data contained in this website is not necessarily real-time nor accurate. The data and prices on the website are not necessarily provided by any market or exchange, but may be provided by market makers, and so prices may not be accurate and may differ from the actual price at any given market, meaning prices are indicative and not appropriate for trading purposes. Fusion Media and any provider of the data contained in this website will not accept liability for any loss or damage as a result of your trading, or your reliance on the information contained within this website.
It is prohibited to use, store, reproduce, display, modify, transmit or distribute the data contained in this website without the explicit prior written permission of Fusion Media and/or the data provider. All intellectual property rights are reserved by the providers and/or the exchange providing the data contained in this website.
Fusion Media may be compensated by the advertisers that appear on the website, based on your interaction with the advertisements or advertisers.
© 2007-2024 - Fusion Media Limited. All Rights Reserved.