With new record highs being set nearly everyday, could we be close to a stock market top?
During the past few days, how many times have you heard the phrase “all time high” used when a stock is discussed? On Thursday, October 24, there were nearly 200 stocks reaching their all time highs during that session alone. Keep in mind that October 24 was one of those rare days when no major stock index hit a record intraday high or closing high.
On the other hand, no major stock index finished in the red on October 24. It was just another day in the life of the quantitative easing-fueled stock market.
In light of the fact that the Dow, (DIA) the S&P 500 (SPY) and especially the Russell 2000 (IWM) are hitting record intraday highs and record-high closing levels on an unusually regular basis, one begins to wonder when – or if – the stock market will finally reach an impenetrable threshold of overhead resistance.
What signs would an investor expect to see if the stock market was finally reaching such a “top”? More importantly, are we beginning to see those signs now?
Looking at the chart for the S&P 500, (SPY) we see the index breaking above the upper Bollinger Band.® When we look back toward the left on the chart to observe the historical performance of the S&P, we find a consistent pattern of retracement back to the lower Bollinger band after the upper band is breached. Is this about to happen again, or will this time be different? Will we just keep climbing in the manner that Jack climbed the beanstalk? Will our climb eventually bring us to the top? If so, when we get there … will there be a giant Marc Faber waiting for us?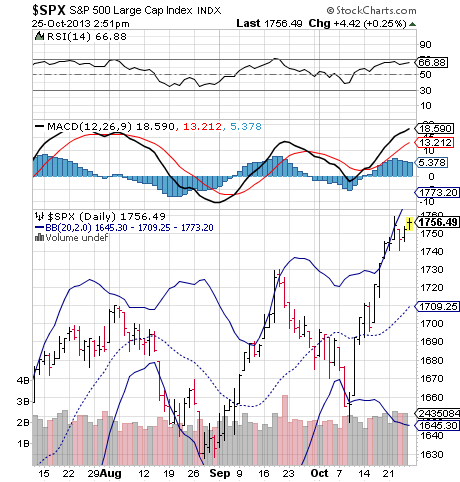
When we observe the performance of the S&P 500 using the system for computing the Price/Earnings ratio for that index, as developed by Nobel Prize-winning, Yale Professor Robert Shiller, we find an impressive bit of information. Many economists prefer Shilller’s “Cyclically-Adjusted Price/Earnings Ratio” or CAPE, rather than the trailing twelve-month P/E ratio, which is currently 19.89. Using Shiller’s formula of averaging earnings over a ten-year time frame, the CAPE (also known as the “PE 10”) is currently 24.95. In Shiller’s system, the numerator of the CAPE is the real (inflation-adjusted) price level of the S&P 500 index, and the denominator as the moving average of the preceding 10 years of S&P 500 real reported earnings, where the U.S. Consumer Price Index (CPI) is used to adjust for inflation. 
Using Robert Shiller’s PE 10, the median – or numerical mid-point of the spectrum is 15.89. The range of the spectrum we are using has 4.78 at the low end (from December of 1920). The high end of our spectrum is marked by the dot-com bubble heyday of December of 1999, when the PE 10 would have been 44.20. The arithmetic mean of the spectrum – which is the same as the average: the total of daily results divided by the number of trading days – comes to 16.49. With our current “CAPE” – or PE 10 – at 24.95, it is 51 percent higher than the mean or average. Put another way, the SP500 is more than 50% overpriced. Furthermore, the reading is the 4th highest in history, surpassed only by 1929, the Tech Wreck and the 2008 Financial Crash. Clearly, we are in rare air.
We have seen how the market goes into a panic mode at every threat of the dreaded taper of the Federal Reserve’s bond purchases. The Chicago Board Options Exchange Volatility Index (VIX) spikes and stock prices fall. Investors know where that $85 billion per month goes when the Fed buys those Treasuries and mortgage-backed securities. The money goes to the primary dealers who invest the money in equities. The idea that demand for stocks will decrease by $85 billion during each month is a scary thought for most investors. Although it won’t happen overnight, and it won’t happen abruptly … we will eventually get to that point and the market knows it. Once we get there, will the stock market continue to perform as it has? Or will we find ourselves in a new, less friendly environment?
Bottom line: U.S. stock indexes are obviously becoming overstretched. Eventually fundamentals will win out as they always do. No one knows when or how the correction will start, but the bigger the bubble blows, the more painful the implosion will be.
Disclaimer: The content included herein is for educational and informational purposes only, and readers agree to Wall Street Sector Selector's Disclaimer, Terms of Use, and Privacy Policy before accessing or using this or any other publication by Wall Street Sector Selector or Ridgeline Media Group, LLC.
- English (UK)
- English (India)
- English (Canada)
- English (Australia)
- English (South Africa)
- English (Philippines)
- English (Nigeria)
- Deutsch
- Español (España)
- Español (México)
- Français
- Italiano
- Nederlands
- Português (Portugal)
- Polski
- Português (Brasil)
- Русский
- Türkçe
- العربية
- Ελληνικά
- Svenska
- Suomi
- עברית
- 日本語
- 한국어
- 简体中文
- 繁體中文
- Bahasa Indonesia
- Bahasa Melayu
- ไทย
- Tiếng Việt
- हिंदी
Signs Of A Stock Market Top?
Published 10/26/2013, 11:13 AM
Signs Of A Stock Market Top?
Latest comments
Loading next article…
Install Our App
Risk Disclosure: Trading in financial instruments and/or cryptocurrencies involves high risks including the risk of losing some, or all, of your investment amount, and may not be suitable for all investors. Prices of cryptocurrencies are extremely volatile and may be affected by external factors such as financial, regulatory or political events. Trading on margin increases the financial risks.
Before deciding to trade in financial instrument or cryptocurrencies you should be fully informed of the risks and costs associated with trading the financial markets, carefully consider your investment objectives, level of experience, and risk appetite, and seek professional advice where needed.
Fusion Media would like to remind you that the data contained in this website is not necessarily real-time nor accurate. The data and prices on the website are not necessarily provided by any market or exchange, but may be provided by market makers, and so prices may not be accurate and may differ from the actual price at any given market, meaning prices are indicative and not appropriate for trading purposes. Fusion Media and any provider of the data contained in this website will not accept liability for any loss or damage as a result of your trading, or your reliance on the information contained within this website.
It is prohibited to use, store, reproduce, display, modify, transmit or distribute the data contained in this website without the explicit prior written permission of Fusion Media and/or the data provider. All intellectual property rights are reserved by the providers and/or the exchange providing the data contained in this website.
Fusion Media may be compensated by the advertisers that appear on the website, based on your interaction with the advertisements or advertisers.
© 2007-2025 - Fusion Media Limited. All Rights Reserved.