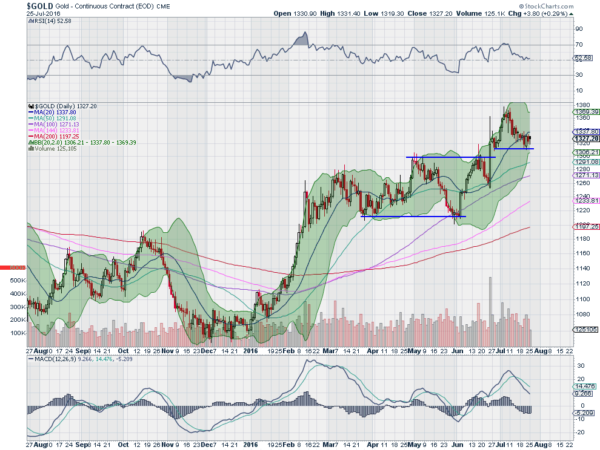
Gold has gotten many investors excited this year. And with good reason. Since the beginning of the year it has risen over $300. The first step was a quick run up over $1220. Then after a 3 month back and forth the shiny metal started higher again in June.
That stopped initially at the prior high at $1300, but not for long. A brief pullback and it was moving higher again, this time to 1370. A couple of long upper shadows and the current pullback began.
That brings gold back to about $1320. And after settling for a few days this may be the next short term bottom. The chart below shows why. Start at the top. The RSI has pulled back to the mid line, but is refusing to move under it.
This momentum indicator is holding bullish. Next the price is easing into support as it touches the late June pullback low. And the last few days have seen smaller body candles, a potential reversal sign.

The Bollinger Bands® are squeezing as well. This is often a precursor to a big move. At the bottom of the chart the MACD is still falling. But it remains positive for now. And the histogram is showing a leveling after resetting lower. This may not be a bottom in the shiny rock. But there are a lot of signs that are lining up to suggest you may want to look at your next long entry.
DISCLAIMER: The information in this blog post represents my own opinions and does not contain a recommendation for any particular security or investment. I or my affiliates may hold positions or other interests in securities mentioned in the Blog, please see my Disclaimer page for my full disclaimer.
