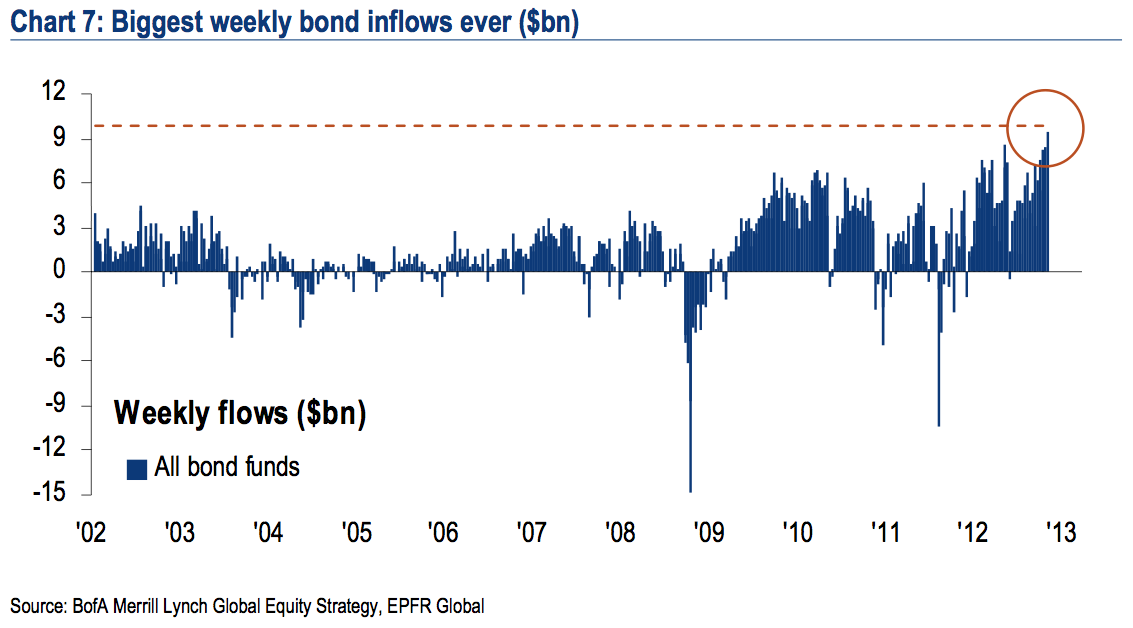
Latest EPFR fund flow data shows that Bonds recorded the highest ever weekly inflow. The bond bubble is definitely approaching its maturity, so those who are piling into these assets right now will most likely be "slaughtered" in the up-and-coming months and quarters. Having said that, the majority of investors view this as a contrarian buy signal for equities, but in my opinion those investors aren't doing their homework. The majority of the retail fund inflows are going into the Corporate and Junk-bond sectors, which indicates retail investors chasing risky assets. In particular, due to euphoric inflows (and record issuance) into the Junk-Bond sector, high yield is now reaching all time record low interest rates. It should be noted that these riskier bond assets correlate very positively with equities. With that in mind, the bursting of the Bond Bubble will actually spell disaster for corporates, especially the high yield junk market, as well as mark the end of the equity bull market that started in March 2009. We are late in the business cycle and on the edge of a recession, as corporate revenues start disappointing with margins mean reverting.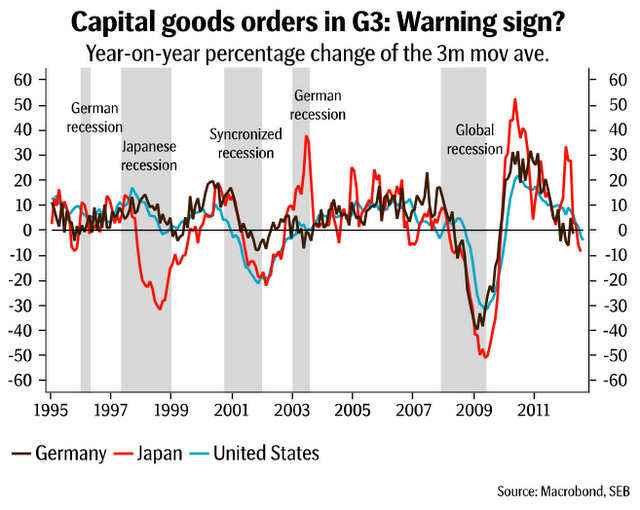
Despite upbeat consensus forecasts, I remain in the recession camp for the 2013/14 period. Globally, capex is falling (usually the first sign of a recession), with manufactured capital good orders in contraction mode for the G3 economies. While the Euro zone is already in a recession that is about to get worse next year, I am also of an opinion that the other G3 economies will follow down the same path. De-coupling has always been a dangerous word and it is not used in my forecasts. The world's third largest economy -- Japan -- is witnessing a rapid fall in industrial production, with machinery orders signalling the country could already be in a recession. With two out of the three G3s already in a slowdown, it is only a matter of time before the US becomes affected too. The first signs of major weakness came as U.S. durable goods orders collapsed in September. Furthermore, inventories are now becoming a net drag on growth, for the first time since 2008. Global growth is at stall speed at best with global demand for goods falling, as already seen by Asian export growth. In my opinion, the current release of "upbeat data" is not to be completely trusted, especially because good news tends to be published around leadership change overs (US & China) to smoothen out the transition -- a perfect example of Machiavellianism.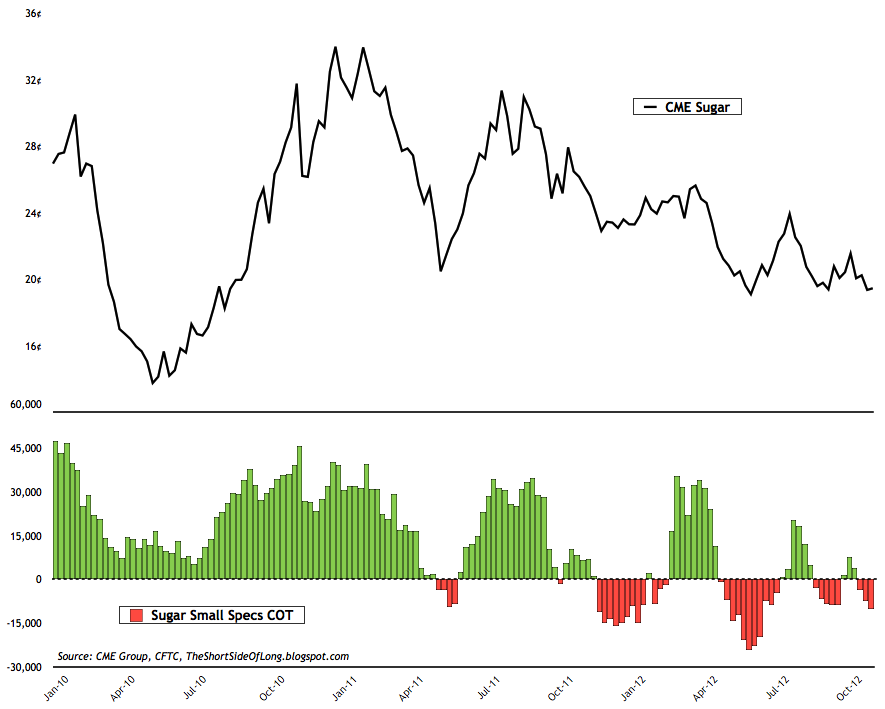
The latest CFTC Commitment of Traders report showed that Small Speculators, also known as Dumb Money, are shorting Sugar as of Tuesday of last week. At the same time, the Daily Sentiment Index (DSI), a measure of optimism from futures traders, is approaching single digit readings. From a contrarian point of view, these sentiment readings indicate that Sugar could be close to an intermediate bottom. Furthermore, as already discussed in a recent in-depth article, Sugar's prolonged bear market, which is currently almost two years old, is creating a good demand and supply equation as farmers cut production, while demand returns with price down more than 45% from the February 2011 peak.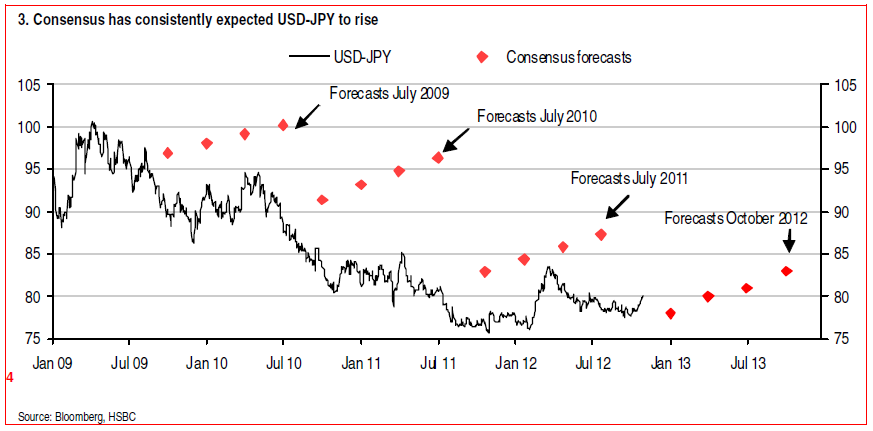
- The chart above shows how ever year consensus forecasts have been too bearish and consistently wrong on the Japanese Yen. I personally believe that the Yen will surprise consensus once again, as the global economy slows and eventually enters a synchronised recession sometime next year. Despite a powerful bull market since 2007, according to the recent Merrill Lynch survey, global fund managers remain least exposed to the Japanese Yen out of all the major currencies. Furthermore, recent CFTC Commitment of Traders report showed that hedge funds are now pilling into bearish bets against the Yen. Furthermore, small speculators also known as Dumb Money, now sit on all time record high net short bets against the Japanese Yen. Historically, these market participants have been a great contrary indicator. Finally, from the technical perspective, the Japanese Yen is currently oversold and most likely in a process of putting in an intermediate bottom.
It has come to my attention that various market participants are calling for the end of a correction. The majority of the CNBC and Bloomberg crowd, usually consisting of various fund managers, has declared the correction over. They claim that a run of a mill 5 to 7% correction has now run its course and it is time to buy back in as the bull market continues. From what I have been reading coming out of investment banks like UBS and Merrill Lynch, technical analysts are also claiming the same. Finally, various bloggers aren't too bearish either, as they see stocks currently oversold and bottoming in the coming days or weeks. From everything I track, I do not think there are any major signs of capitulation yet. Let me explain.
I personally believe there is no holy grail indicator or tool out there to tell us when the market is in capitulation mode and about to bottom out. At least I haven't found one just yet, but if you have -- make sure you email me immediately (but do not tell anyone else haha)! Therefore, what we need to do is put together a lot of sentiment and technical indicators to see if and when they confirm each other. When the majority of basic indicators signal oversold and over pessimistic conditions, most likely it pays to be a contrarian. Just as the annoying kid consistently asks his parents that infamous question, we too want to know, "Are we there yet"?
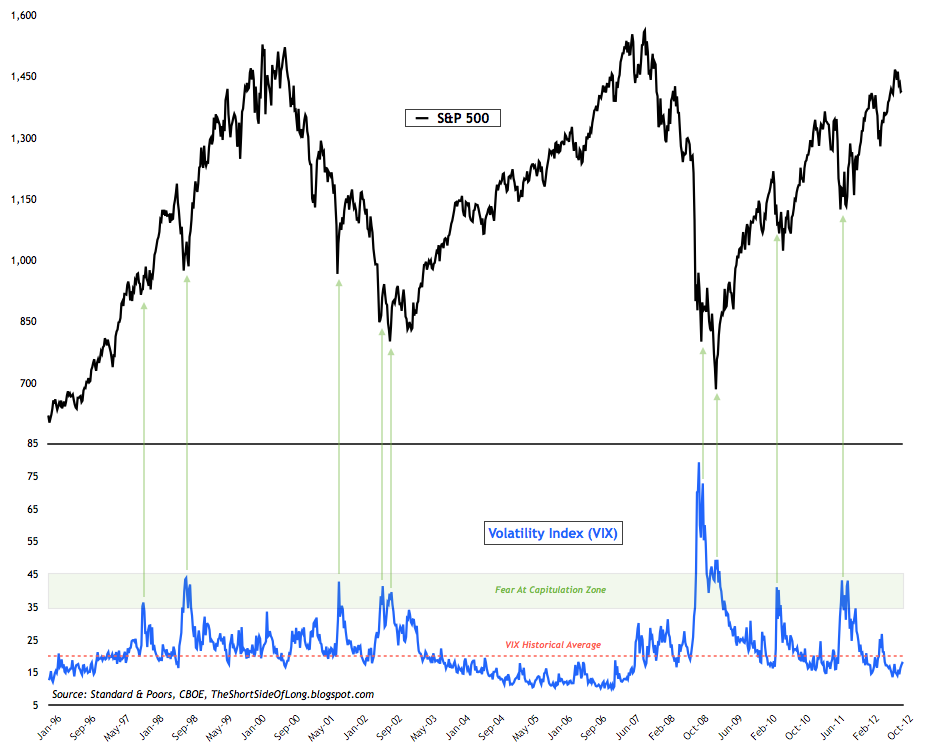
One of the easiest and most straight forward ways we can see that the market has witnessed a fear or panic capitulation moment is by tracking the ever popular Volatility Index, also known as the VIX. A weekly closing spike above 35 usually does the job.
Verdict: in my opinion we are not there yet.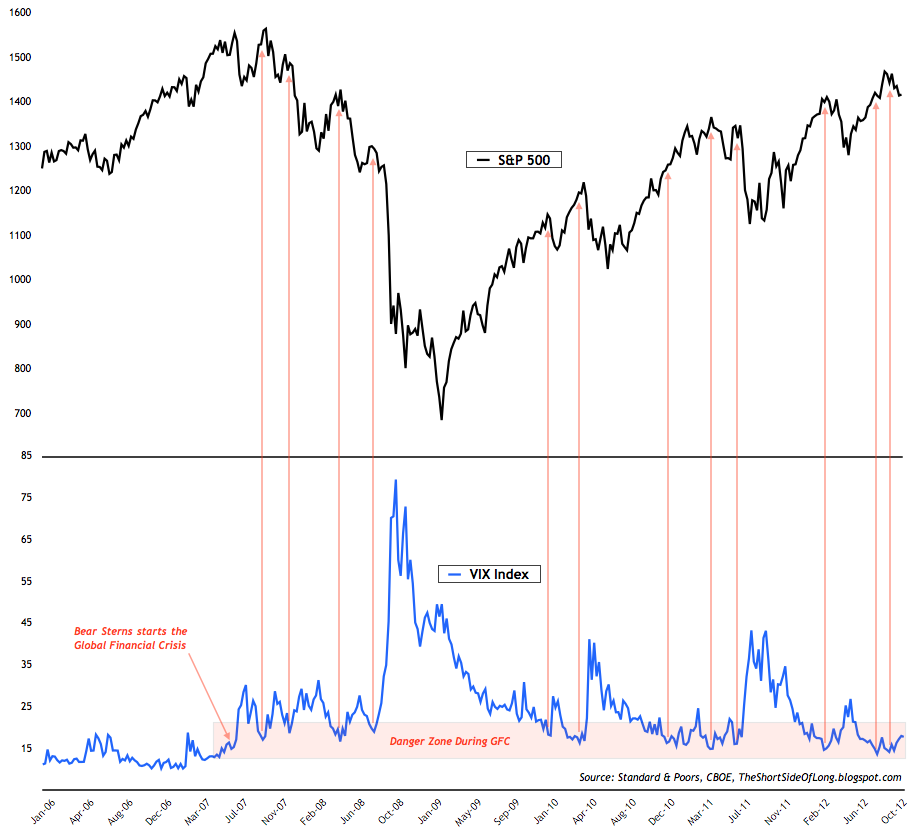
Furthermore, I personally think that the VIX still remains in the so called danger zone. This means that the current market conditions are described as very complacent, which usually signals an intermediate top instead of a bottom.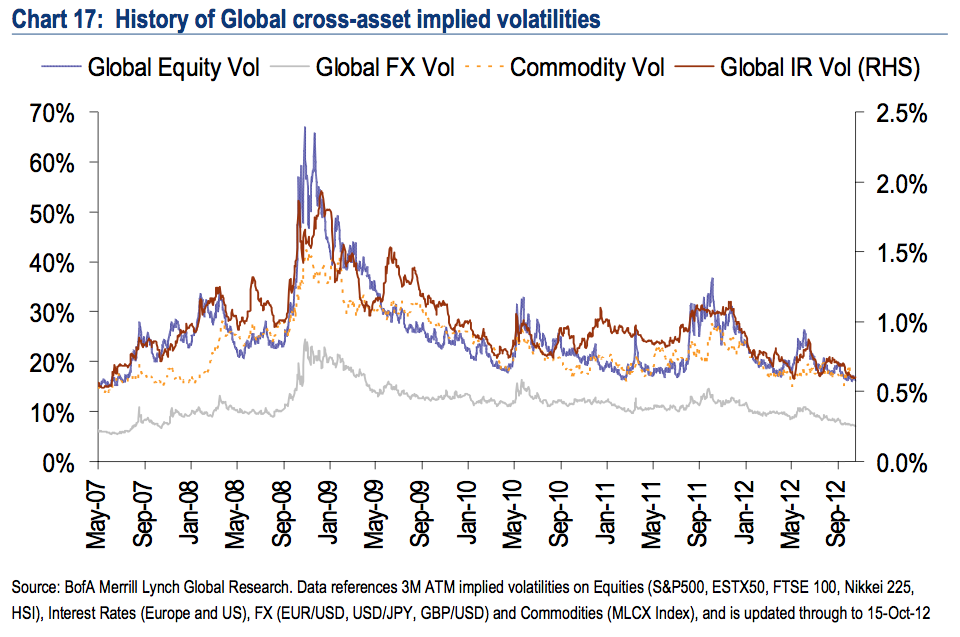
Global volatility indices for other asset classes also show a similar picture. It is as if the markets have paused for the time being as US and China roll through their leadership changeovers, before we get back to business. Global equity volatility, foreign exchange volatility and commodity volatility are all at their lowest levels since at least 2007. In my opinion, this is a very worrying signal.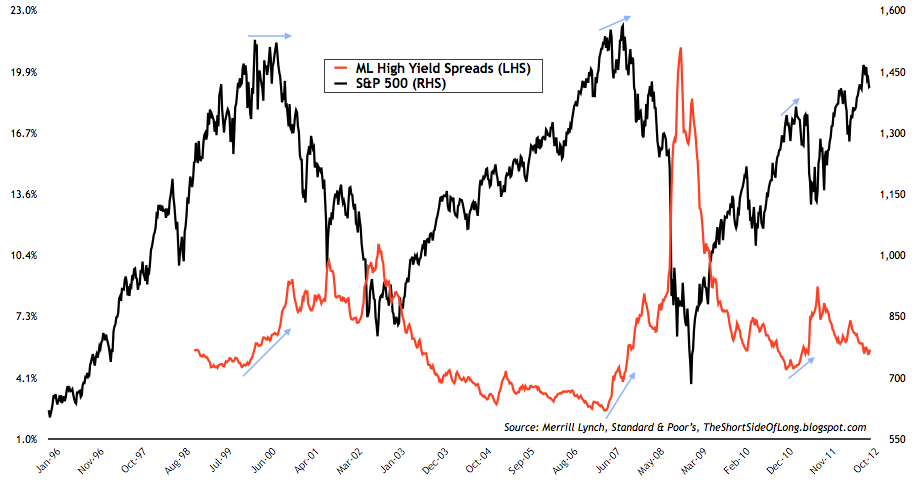
Connected very closely to volatility are various credit spreads in the bond market. My personal favourite is the spread between Merrill Lynch High Yield and equal maturity U.S. Treasury Bond known as the ML High Yield Master Index. With spreads back to May 2011 lows (last equity market top) and Junk-Bond yields at record lows, trouble could be brewing ahead.
Verdict: in my opinion we are not there yet.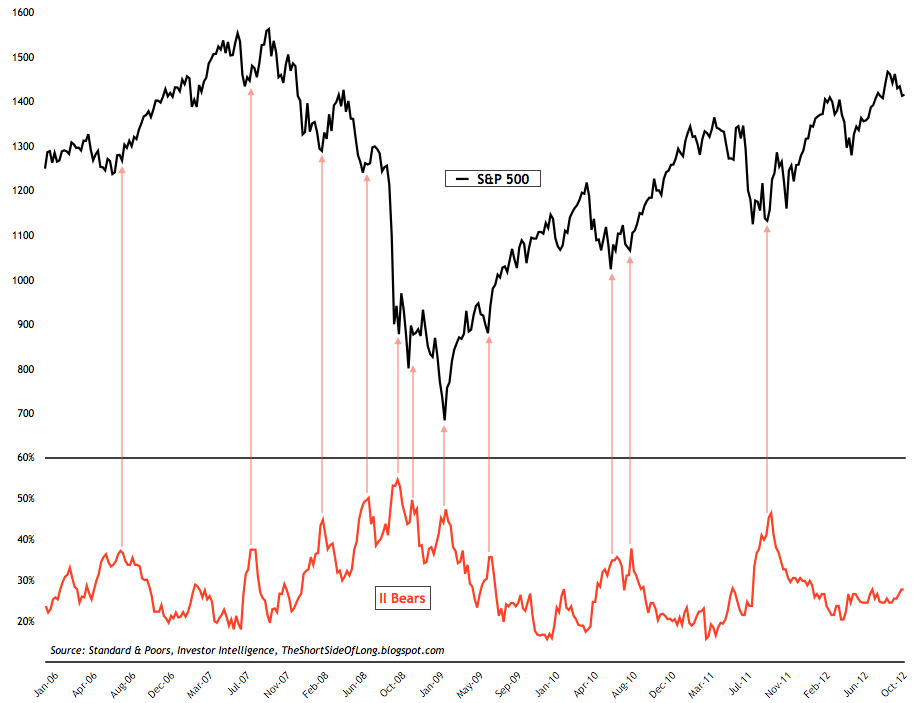
Investment advisors are also not too worried right now. Recent Investor Intelligence Bear readings have remained at complacent levels for months and months... and months. This is usually a signal that we are closer to an intermediate top rather than a bottom. Verdict: in my opinion we are not there yet.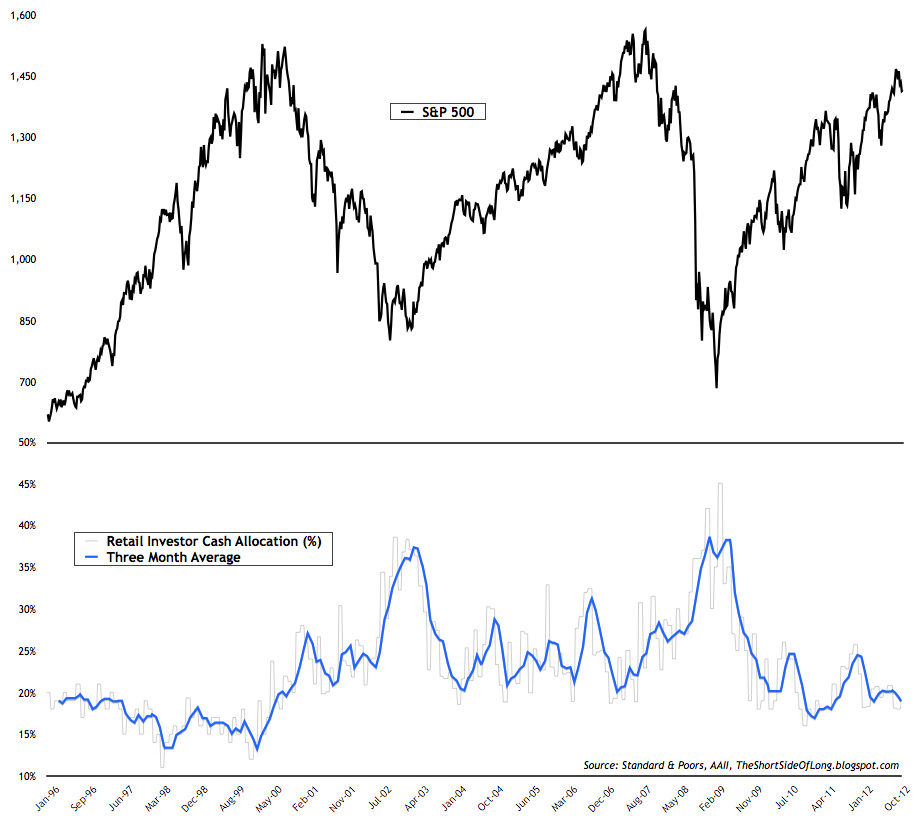
Confirming this view are various cash level readings of market participants. One of my favourites to track is the AAII Asset Allocation survey, which comes out once a month and is a less volatile measure than the weekly survey. With cash levels of retail investors falling to the lows of May 2011 (last equity market top), I think market participants are just way too complacent.
Verdict: in my opinion we are not there yet.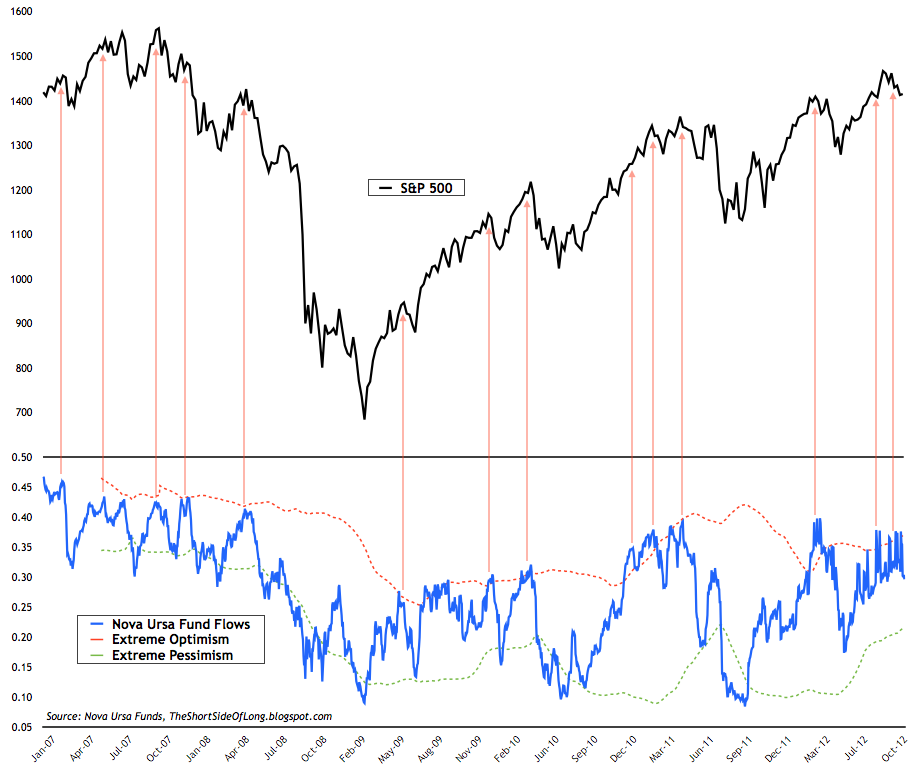
Another way to track what retail investors are doing, instead of thinking, is to look at the fund flows at the Rydex funds. One of the most popular measures of market sentiment is known as the Nova Ursa indicator and for the last few months, it has been signalling investor's appetite for stocks, which is very high. Looking at the chart above, it could be said that we have been given a contrarian sell signal with an intermediate top in place.
Verdict: in my opinion we are not there yet.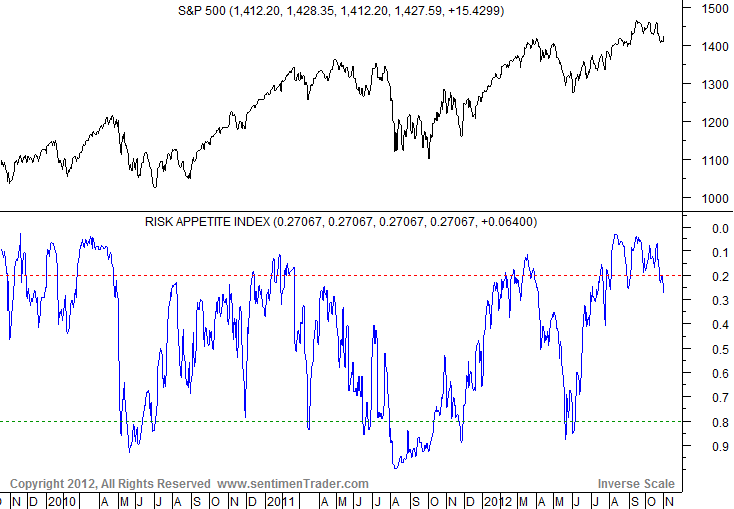
Generally, the risk appetite has been extremely strong since July 2012, as we can see in the chart above thanks to SentimenTrader website. Investors everywhere have been chasing risk assets due to various fundamental and technical reasons. This has created a group think mood of stock price extrapolation into the future. On the other hand, the chart above signals that the risk appetite readings could most likely be a contrarian sell signal.
Verdict: in my opinion we are not there yet.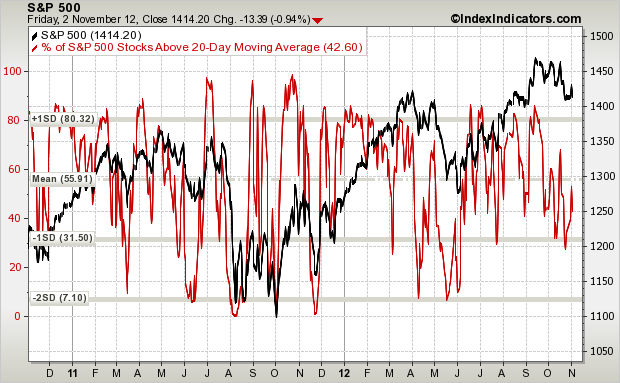
Moving away from various sentiment readings, the stock market internals (breadth) are also not yet washed out. Consider the very simple chart above, which measures the short term readings of all S&P 500 stocks above the 20-day moving average. Currently, there are still 43% of components above this short-term MA and for the market to turn oversold, we usually need to see readings drop below 10% or two standard deviations from the mean of 56%.
Verdict: in my opinion we are not there yet.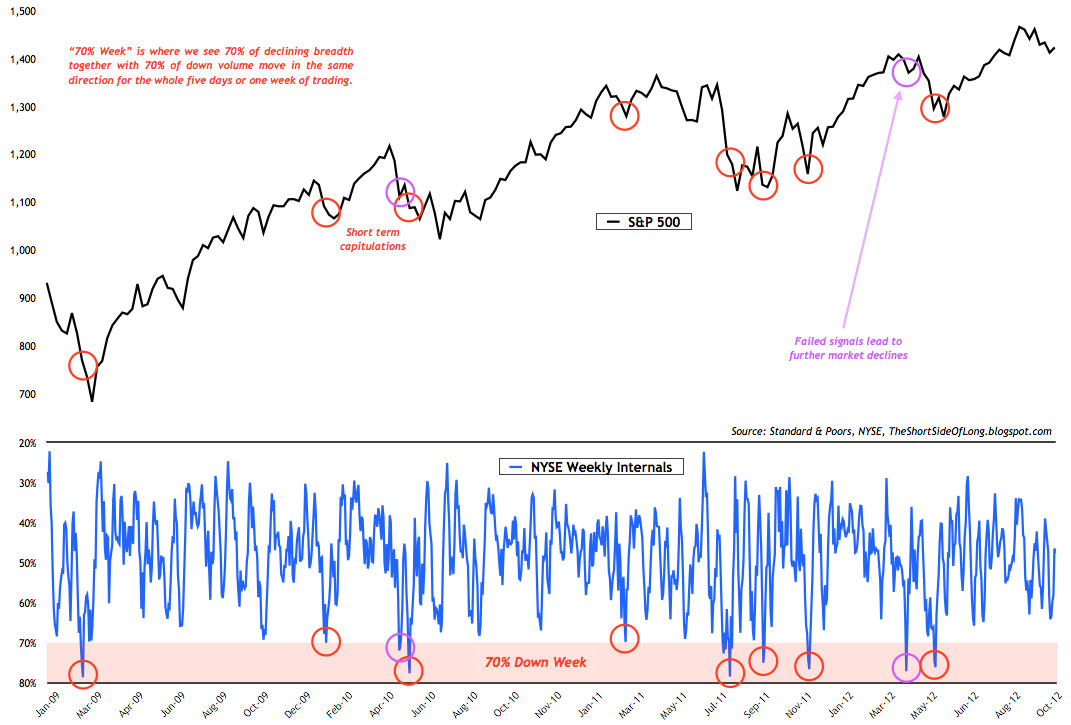
Another short term breadth measure is an a very basic indicator I created called Weekly Internals. It tracks cumulative weekly readings of the NYSE advancers minus decliners and up volume minus down volume. In other words, it is the smoothed weekly buying and selling pressure. The capitulation zone usually occurs when 70% or more of all stocks and their volumes move on the downside during the week. Currently sitting in a neutral zone, we are not anywhere close to oversold readings.
Verdict: in my opinion we are not there yet.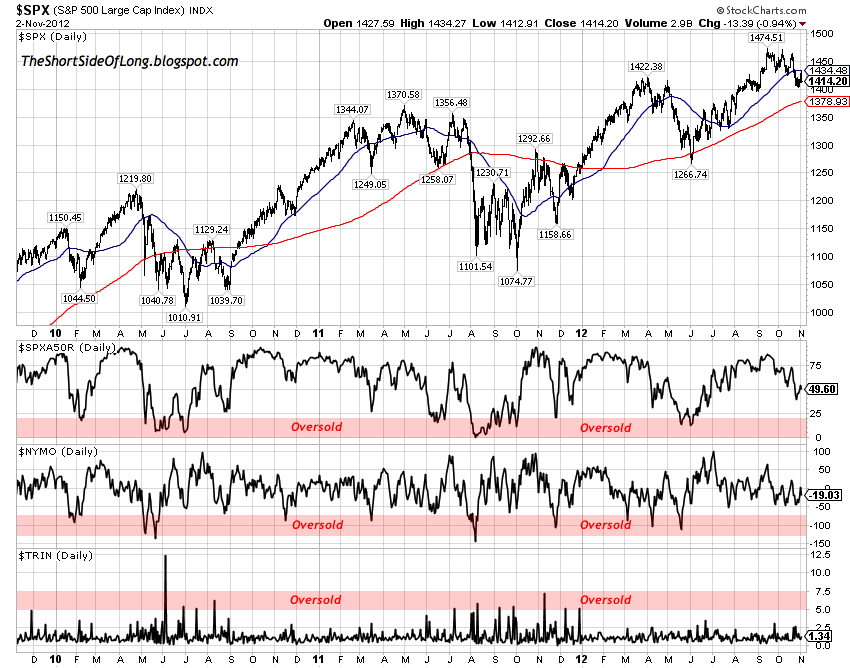
Other short term breadth measures I usually track are shown in the chart above. They are the percentage of stocks above 50 day MA, McClellan Oscillator and daily TRIN readings. All three indicators have a basic oversold level and all three indicators are not signalling oversold conditions.
Verdict: in my opinion we are not there yet.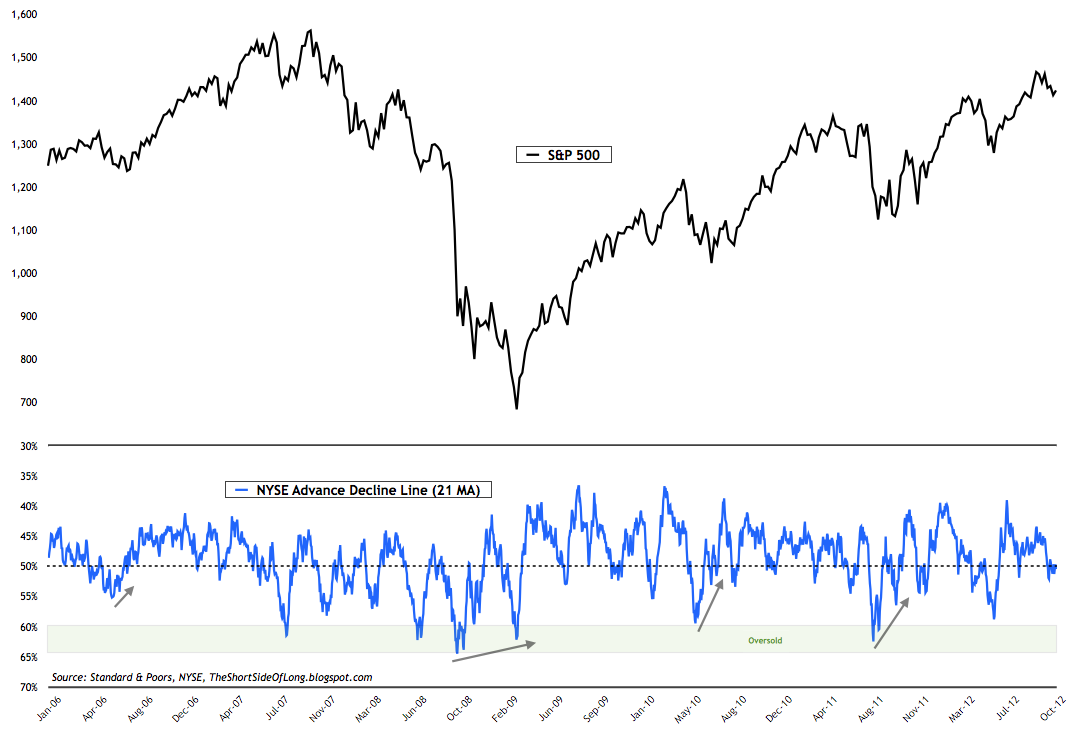
Longer term breadth measures also show the same picture. The long term advance decline line, averaged over 21 days or one month of trading, shows that we are currently at neutral readings and nowhere near oversold levels.
Verdict: in my opinion we are not there yet.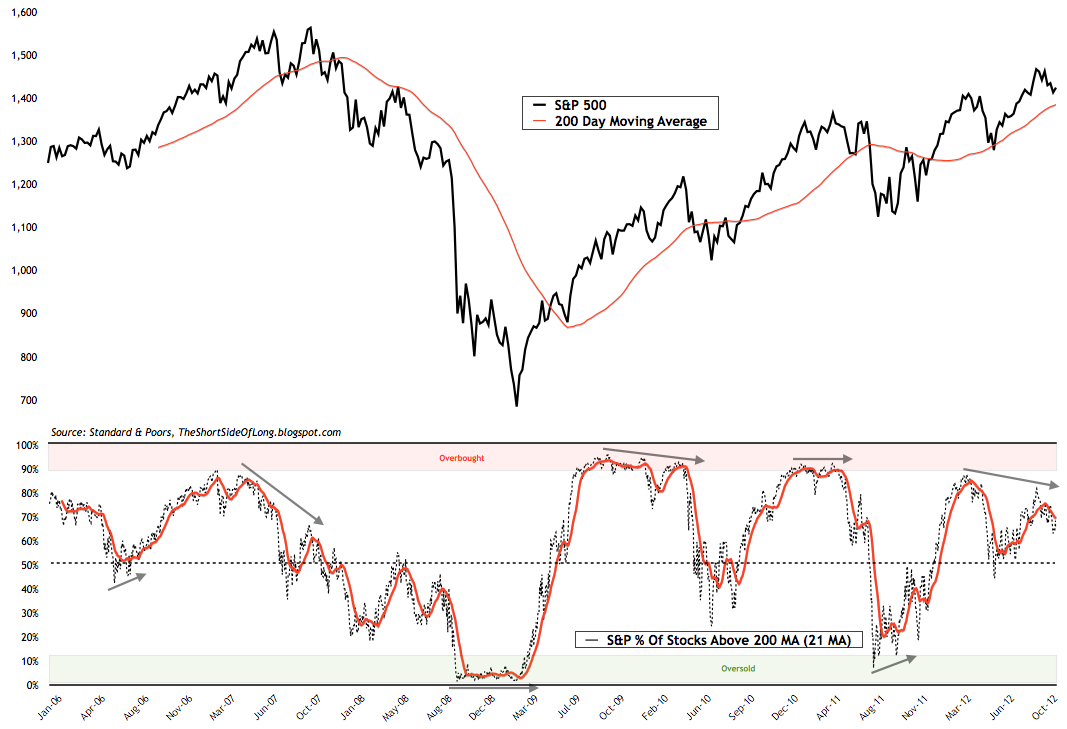
The percentage of stocks above the longer term 200 day moving average is also nowhere near oversold levels. As a matter of fact, the smoothed 21 day average of the readings above, shows that the breadth strength is now rolling over and starting to narrow. Furthermore, we can see that a bearish divergence between lower breadth readings and higher stock prices into September 2012. All of these are usually typical signs of a downtrend at its beginning and not at its end.
Verdict: in my opinion we are not there yet.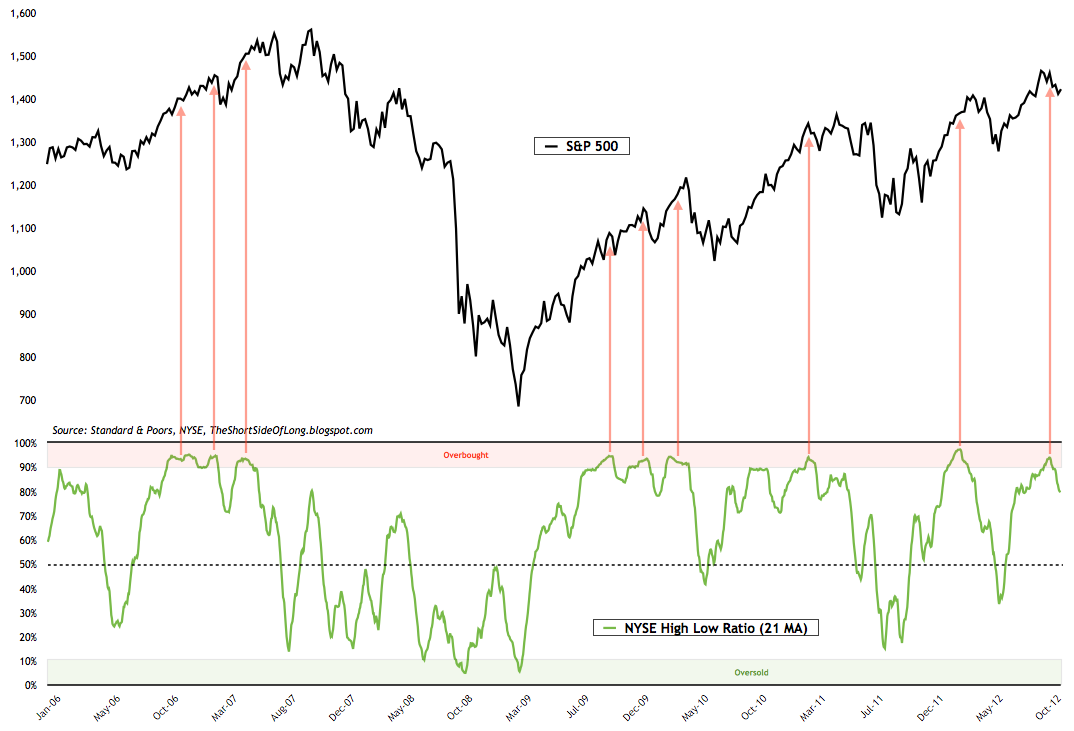
Moving along, we can also see that the NYSE 52 week high low ratio, averaged over 21 days or one trading month, shows that readings have just exited overbought territory. That itself signalled an intermediate top and a correction in progress. When does that correction end? During bull markets, correction readings fall below 50%, but if I am right in forecasting a bear market, readings might go much lower towards the true oversold zone of 10%.
Verdict: in my opinion we are not there yet.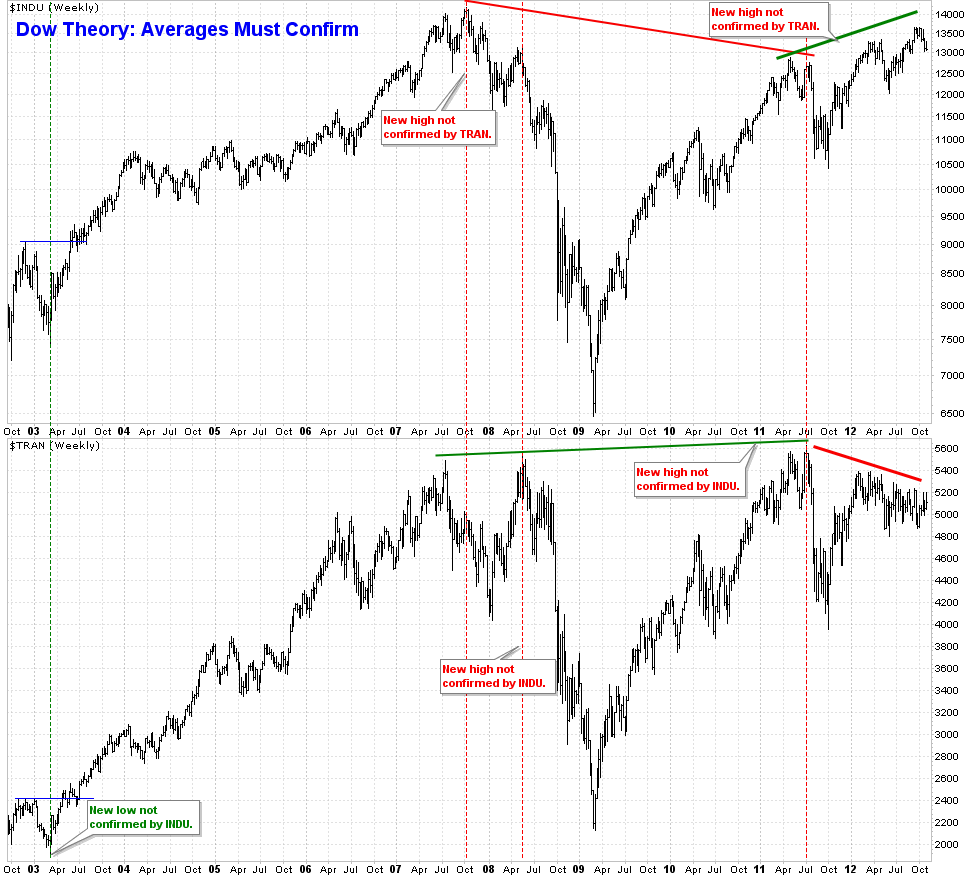
Moving away from breadth and towards basic technical price action, we can see in the chart above that we have a classic non confirmation in the Dow Theory. These usually get resolved to the downside, especially when stocks remain in a long term secular bear market.
Verdict: in my opinion we are not there yet.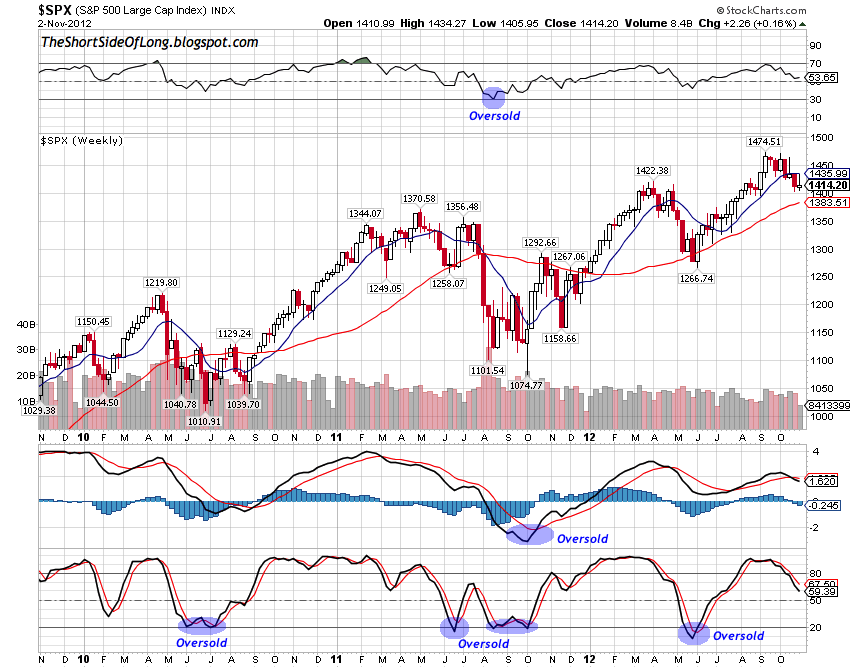
I am definitely not an expert in technical analysis and momentum readings, and I rather not be because charts have very lousy prediction probabilities unless you incorporate them together with the fundamentals of the business cycle as well as sentiment readings. Having said that, just looking at the weekly basics, I see no minor or major oversold readings right now. As a matter of fact it seems to me that the weekly MACD is now giving us a selling signal instead.
Verdict: in my opinion we are not there yet.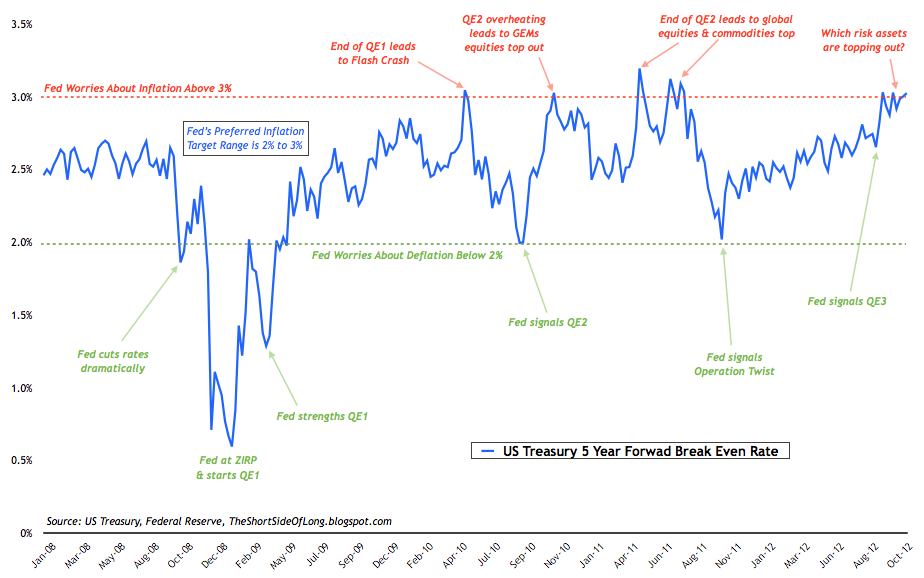
Finally, away from the stock market indicators, the bond market readings of future inflation expectations, also known as Break Even rates, have been overheating for a few weeks now. That tells us the current inflation trade is looking somewhat overcooked and mainly a consensus bet. Historically, a deflation trade (long Treasuries, Dollar, Yen, VIX) surprise tends to be just around the corner, as market participants start cutting risk exposure rather quickly. Furthermore, I personally think the Fed engaged into QE3 prematurely, instead of waiting for Break Even rates to fall back down to 2% range. This has now most likely topped the risk on trade, just like we saw in April 2010, November 2010 and between February & May of 2011. Verdict: in my opinion we are not there yet.
Trading Diary (Last update 25th of October 12)
- Economic Outlook: The global economy continues to slow towards a recession, as we find ourselves in the very late cycle of the expansion. United States growth remains below 2% for five out of the last six quarters, with durable goods new orders collapsing recently. Euro zone remains in a recession, as Germany dangerously flirts with a contraction in growth. German CEOs see the business cycle moving deeper into a downturn with a high probability of recession. Japanese growth rates are once again anaemic post earthquake recovery, with Industrial Production slowing meaningfully. Chinese growth continues to slow for the seventh quarter in a row, however many do not believe official growth data. Business confidence is decreasing rapidly, while the manufacturing sector is in doldrums for a year, confirmed by the slowest electricity consumption since 2009. More importantly the price of cement, iron ore and steel has crashed recently, indicating the end of the property building boom. Finally, exports are now slowing rapidly, while railway cargo freight is looking very weak.
- Important Indicators: Cash levels within mutual funds, retail investors, hedge funds and money market funds are at extreme lows, volatility is at very complacent levels and credit spreads are very narrow relative to fundamentals. We are witnessing bubble-like record fund inflows into Junk Bond market, a very dangerous signal.
- Long Positioning: Long focus is towards the secular commodity bull market, with positions in Precious Metals (weighted heavily towards Silver) and Agriculture. A small individual position in Sugar was recently added. Underlying position as well as call options are held on Japanese Yen (long dated OTM).
- Short Positioning: Short focus is towards the secular equity bear market, with positions in Dow Transports, Technology, Discretionary, Industrials and Junk Bonds. Put options are held on Apple, Amazon and recently Salesforce (long dated OTM). Put options are held on Pound and Loonie (long dated OTM).
- Watch-list: A major short in due time will be U.S. Treasury long bonds, as they are extremely overbought and in the midst of a huge bubble. While Grains have exploded, Softs present amazing value for investors. Japanese equities are down about 80% from their all time high over two decades ago and offer great value.
