A recent article in the Economist suggested that there was:
…… a remarkable improvement in America’s external accounts. At the end of 2005 the current-account deficit reached 6.2% of GDP, the sign of a society living dangerously beyond its means. But by the third quarter of 2013 it had dropped to 2.2%, the lowest since 1998, a level it could easily sustain indefinitely.
The current account deficit should never be a major concern as the flows must balance out over time – one way or another. But what made this post interesting to me was the discussion of the decline in imports – which were attributed to:
- lower oil imports and higher domestic production of oil;
- the demographic shift of boomers from spending to saving;
- more favorable dollar and rising foreign labor rates favor USA over foreign production.
This post was accompanied by the following graphic: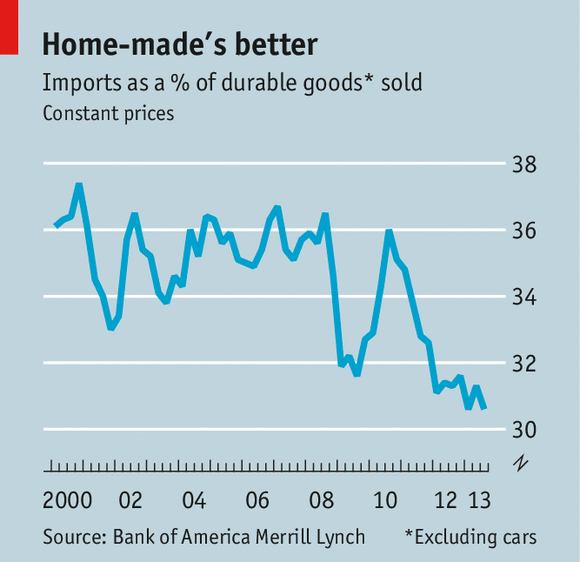
Adding to this story, it is very obvious that imports have been stagnating. The graph below is based on current dollar – and shows there has been no growth since 2007 (which means inflation adjusted growth has contracted) just as the graphic above suggests.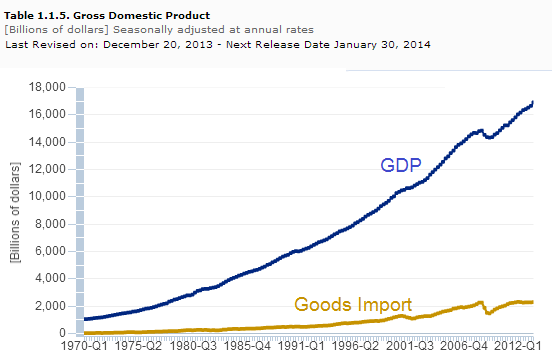
Although the Economist post talks about oil production being up in the USA (and therefore requiring less oil imports), the driving factor historically was price (not the quantity of oil being imported). For the last two years, oil imports had little effect on the growth or contraction of imports.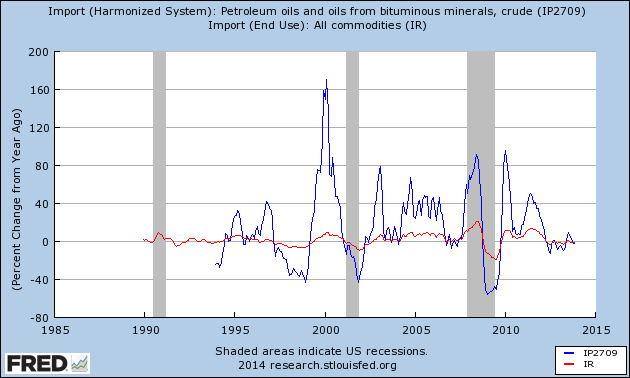
Remember the good ole days when most believed the USA was going to be manufacturing nothing within a few years. Although China is now the world’s number one manufacturer, this was not at the expense of destroying USA production.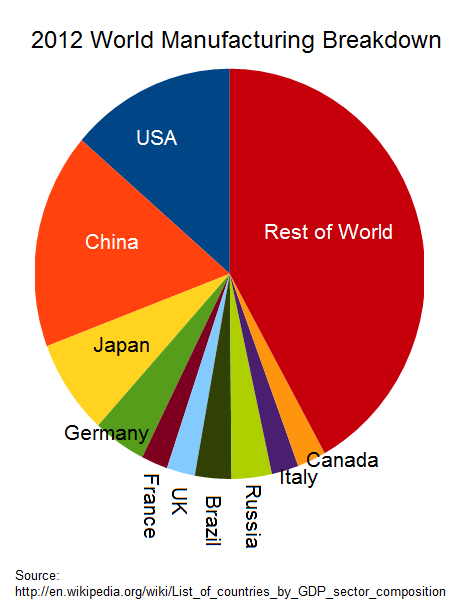
So the USA’s production is now growing at approximately its historical rate of growth, and manufacturing employment has returned to growth – growth in manufacturing employment has not occurred since the 1990s.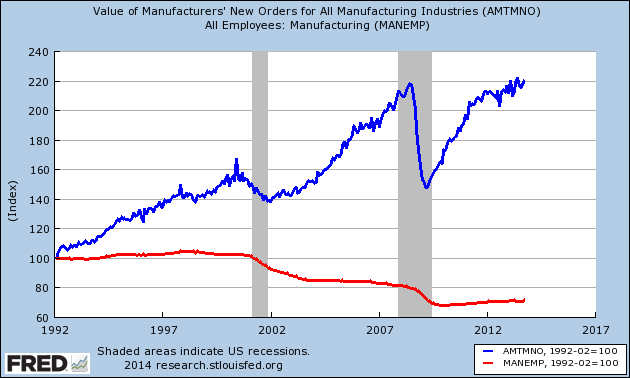
I have blamed free trade agreements for the decline of manufacturing employment from 2000 until the Great Recession. The days of the free trade agreements sucking jobs out of the USA are over for a variety of reasons (primarily logistics).
As the above chart shows, there is now a slight growth in employment in the manufacturing sector as manufacturing returns to the USA. However, the new dynamic in employment is robotics – and this dynamic will likely grow stronger in the coming years. Dynamics are funny things, and can change momentum and direction with few noticing. For now, I consider this THE dynamic to watch in jobs growth.
Going forward in 2014, the shrinking growth in imports is at least signalling that the USA economic growth is becoming more balanced between what is being produced domestically and what needs to be imported.
Other Economic News this Week:
The Econintersect economic forecast for January 2013 predicted a slowing economic growth after several months of increasing growth. What this forecast cannot see is the effect of Obamacare – but slowing of growth in this forecast was primarily the result of the business sector.
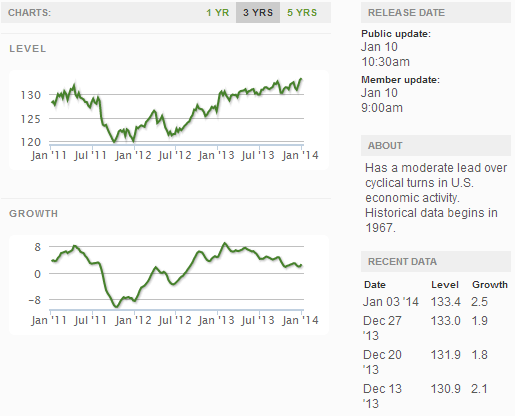
The ECRI WLI growth index value has been weakly in positive territory for over four months – but in a noticeable improvement trend. The index is indicating the economy six month from today will be slightly better than it is today.
Current ECRI WLI Growth Index
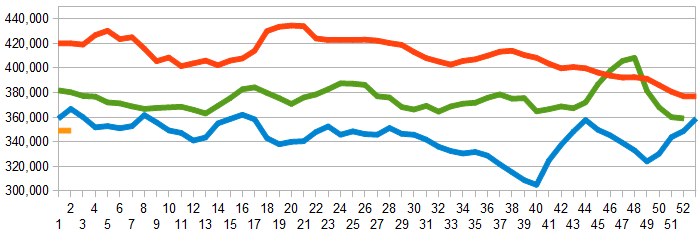
Initial unemployment claims went from 339,000 (reported last week) to 330,000 this week. Historically, claims exceeding 400,000 per week usually occur when employment gains are less than the workforce growth, resulting in an increasing unemployment rate. The real gauge – the 4 week moving average – improved from 357,250 (reported last week) to 349,000. Because of the noise (week-to-week movements from abnormal events AND the backward revisions to previous weeks releases), the 4-week average remains the reliable gauge.
Weekly Initial Unemployment Claims – 4 Week Average – Seasonally Adjusted – 2011 (red line), 2012 (green line), 2013 (blue line), 2014 (orange line)
Weekly Economic Release Scorecard:
Click here to view the scorecard table below with active hyperlinks

