Bullish and bearish factors have been pulling the price of crude oil in opposite directions over the past months. The price had been moving lower under the weight of the trade war between the US and China. The wave of protectionist policies continues to threaten a global recession. Crude oil demand is a function of global economic growth.
On the other side of the geopolitical equation, tensions surrounding Iran continue to underpin the price of oil. The September 14 drone attack knocked out 50% of Saudi oil output, and 6% of the world’s supplies. The attack was a reminder of the turbulent politics in the region of the world that is home to 50% of the world’s oil reserves.
Last week, a falling stock market and continued political drama around the world caused the price of oil to drop to the bottom end of its trading range at just over $50 per barrel. The latest data on crude oil inventories in the US provided a conflicting view of the state of supply and demand for the energy commodity. The United States Oil Fund (NYSE:USO) replicates the price action in the crude oil futures market.
The API report was bullish
On Tuesday, October 1, the American Petroleum Institute told the oil market that stockpiles of the energy commodity fell by 5.92 million barrels for the week ending on September 27. The consensus estimate was for a rise of 1.567 million barrels. The API said that gasoline stocks rose by 2.133 million barrels and distillate inventories fell by 1.741 million barrels. While the increase in gasoline as more than the market’s estimate of 449,000 barrels, the API report was supportive of the price of crude oil.
The next day, the Energy Information Administration’s report sent the price of oil lower.
The EIA data was bearish
On October 2, the EIA said that oil stocks rose by 3.1 million barrels for the week ending on September 27. The swing of almost nine million barrels between the API and EIA reports was a lot more than a rounding error. The gasoline data also diverged as the EIA said stocks dropped by 200,000 barrels. When it comes to distillate products, the EIA reported a more substantial decline of 2.4 million barrels.
The divergence between the API and EIA data was significant, but the price of crude oil fell in the aftermath of the EIA release.

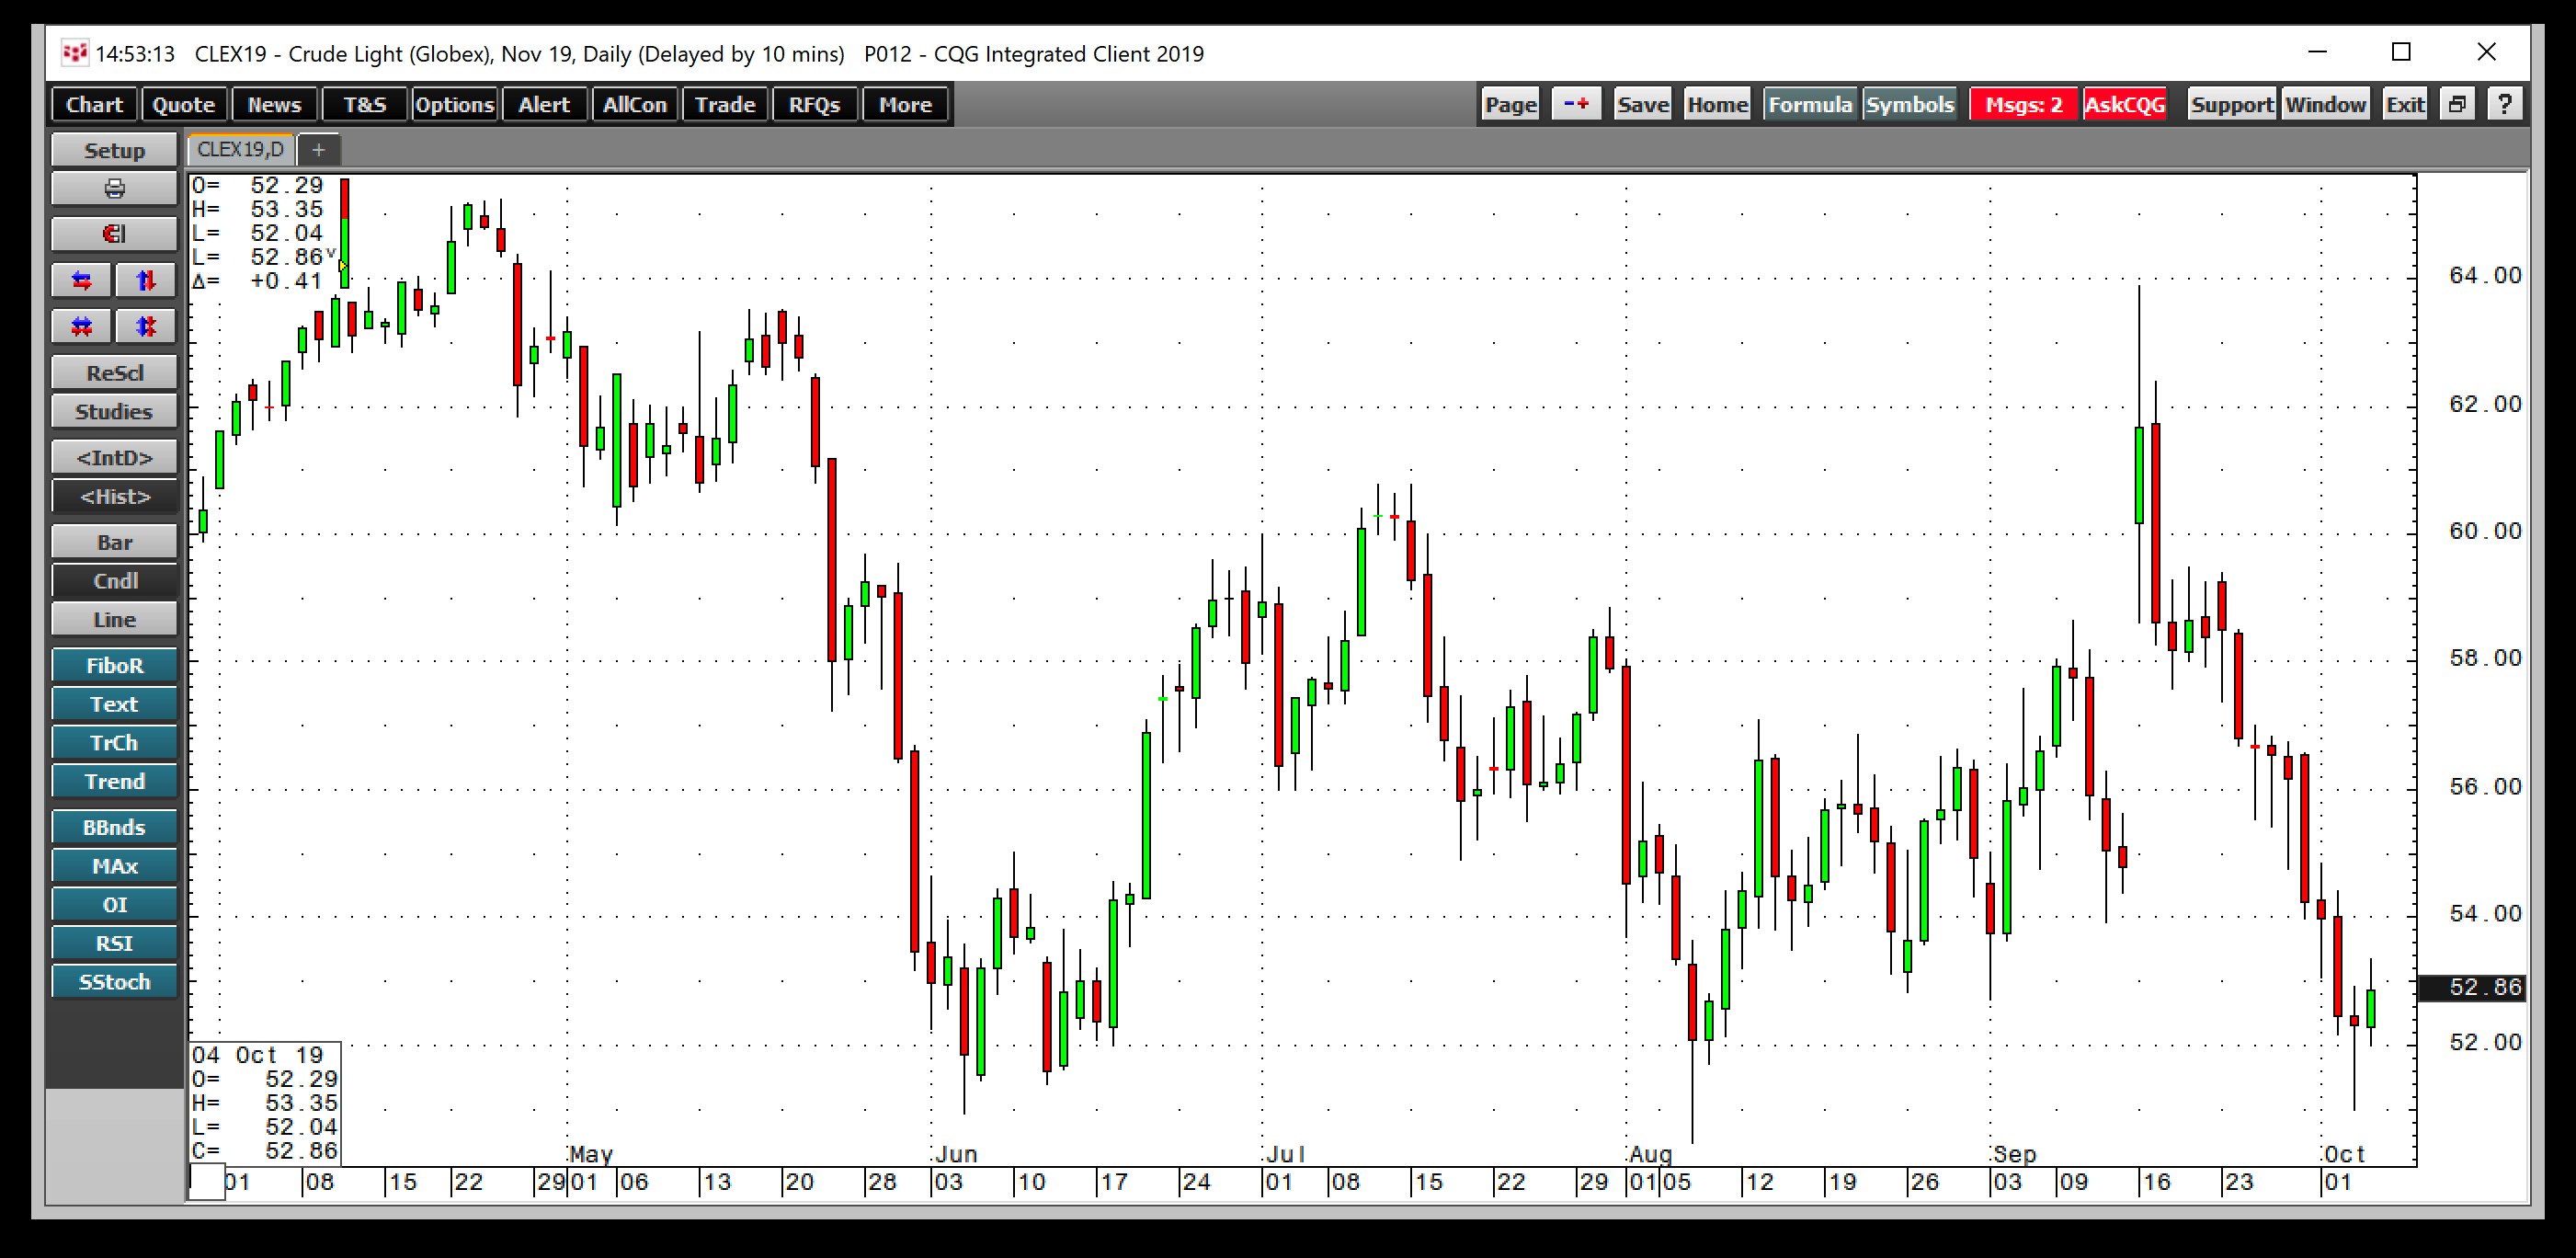
As the chart shows, the price of nearby November NYMEX crude oil futures contract fell to a low for the week at $50.99 on October 3. Selling accelerated after the release of the EIA data on October 2.
Meanwhile, the price action in oil products suggests another level of uncertainty when it comes to the path of least resistance for the price of crude oil.
Crack spreads move higher while oil falls
Crack spreads reflect the cost of refining a barrel of crude oil into oil products. The processing margin can also serve as a barometer when it comes to demand for oil-based products. Since crude oil is the primary ingredient in refining, strength, or weakness in oil product prices often translates to the same in the price of the raw energy commodity.

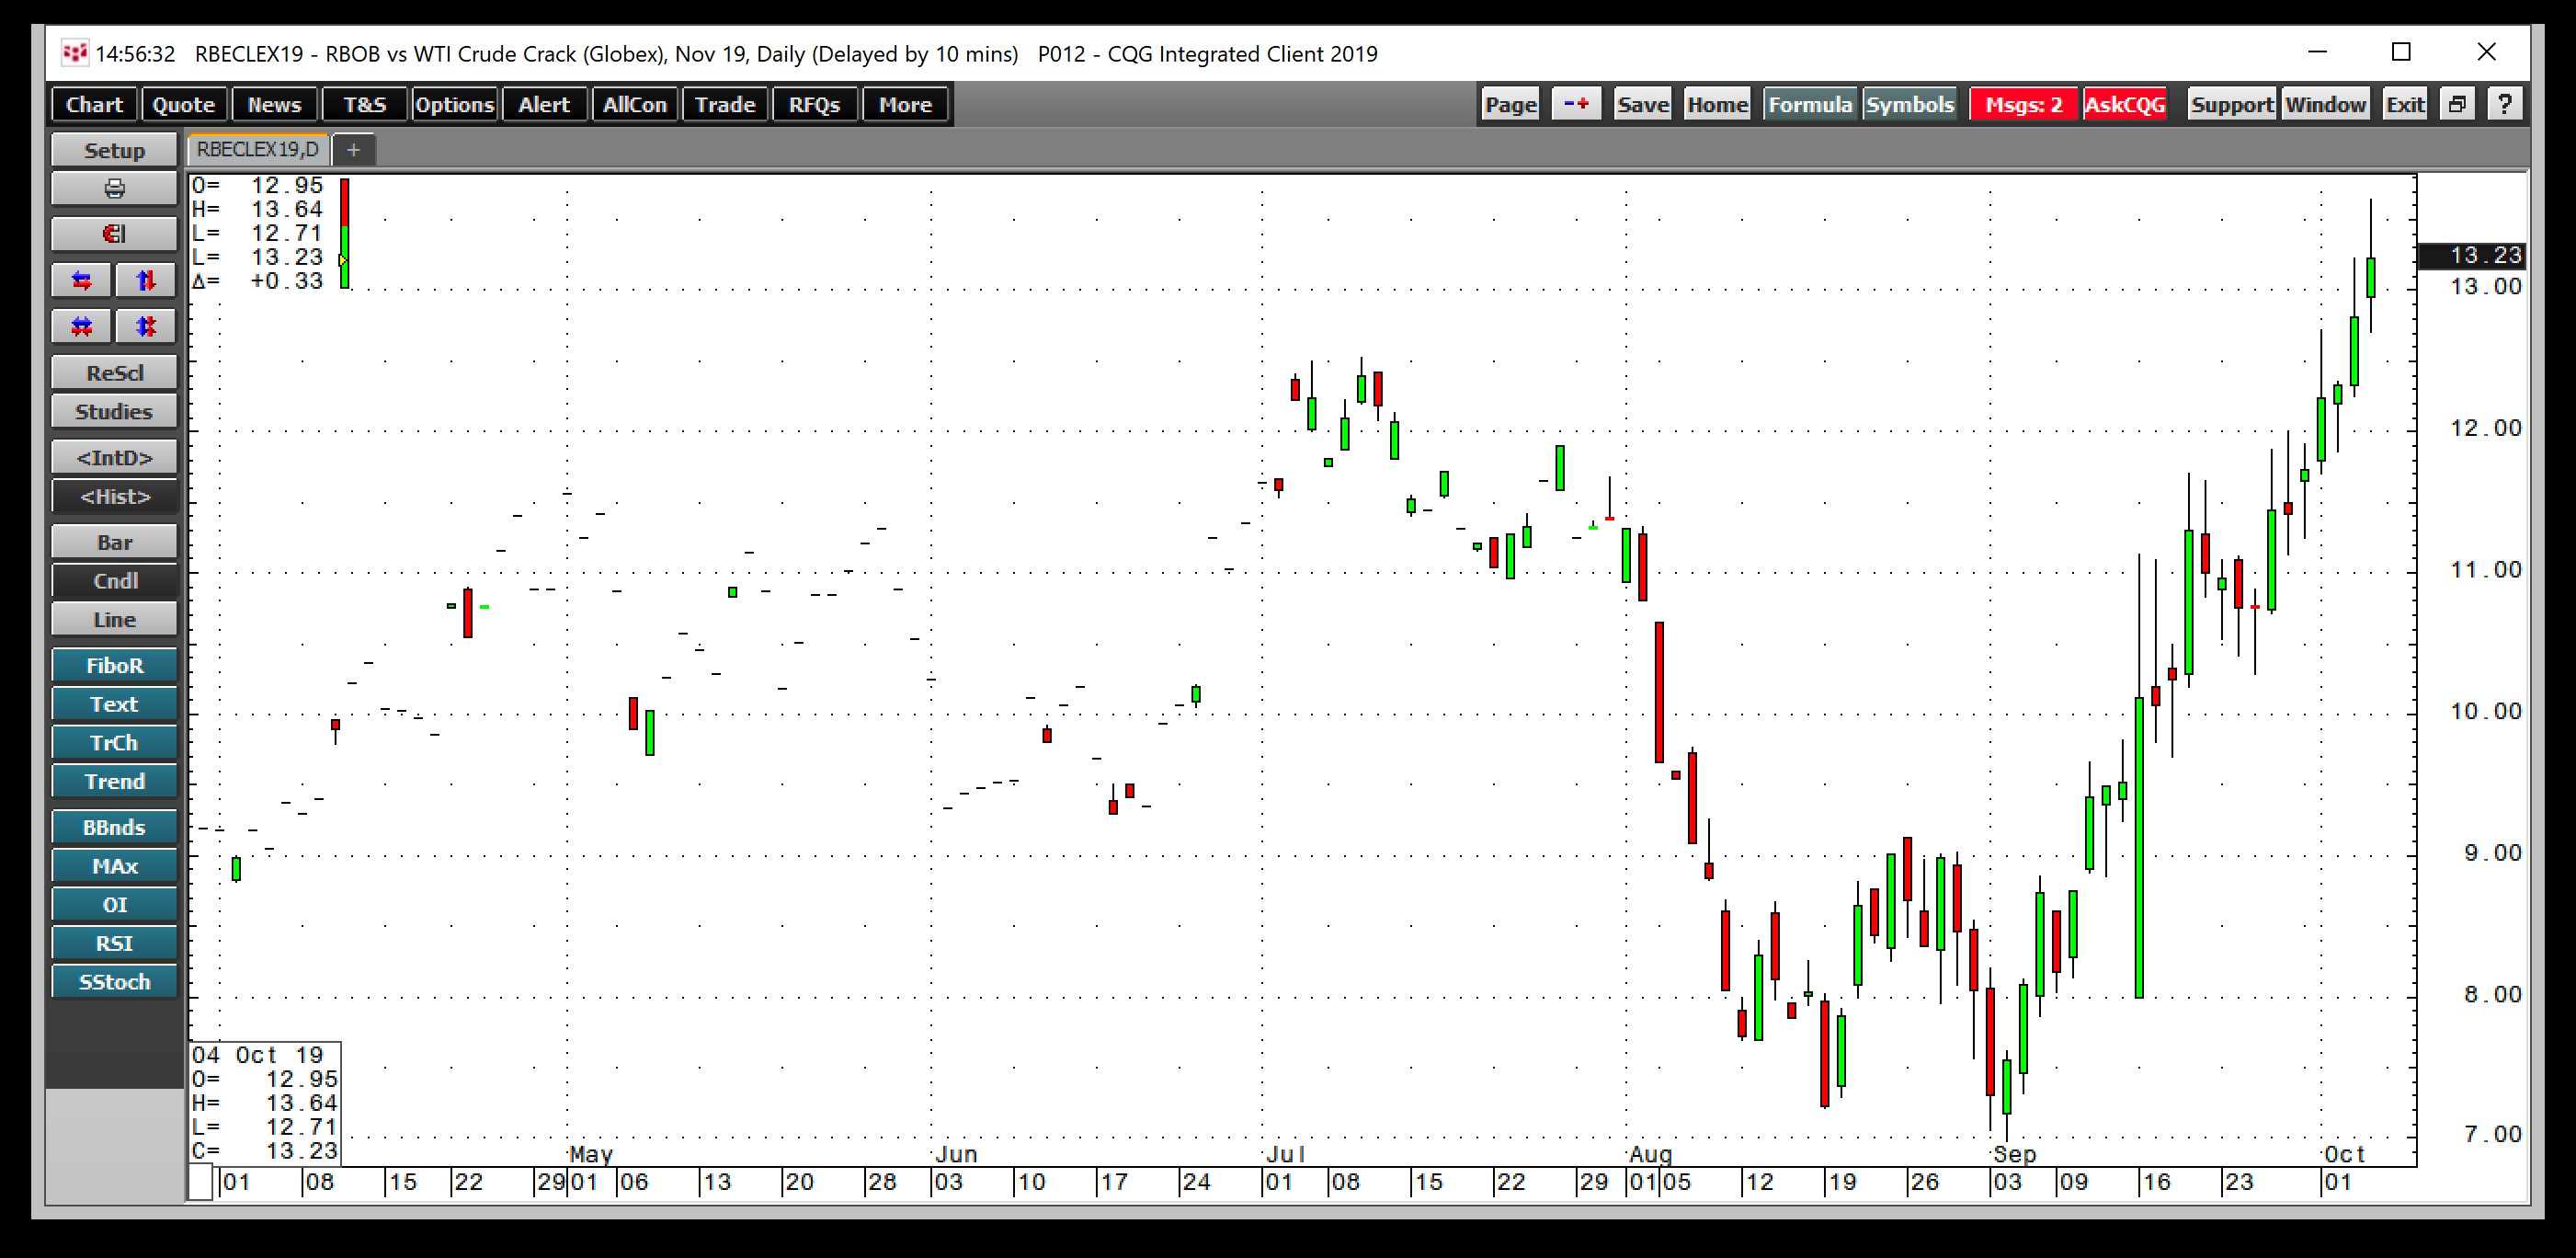
The daily chart of the gasoline crack spread shows that the oil product has outperformed crude oil. The November spread rose from $6.97 on September 4 to a high at $13.64 last Friday and closed the week above the $13 per barrel level. The rise in the gasoline crack spread is even more impressive as we are now in the offseason for gasoline demand.

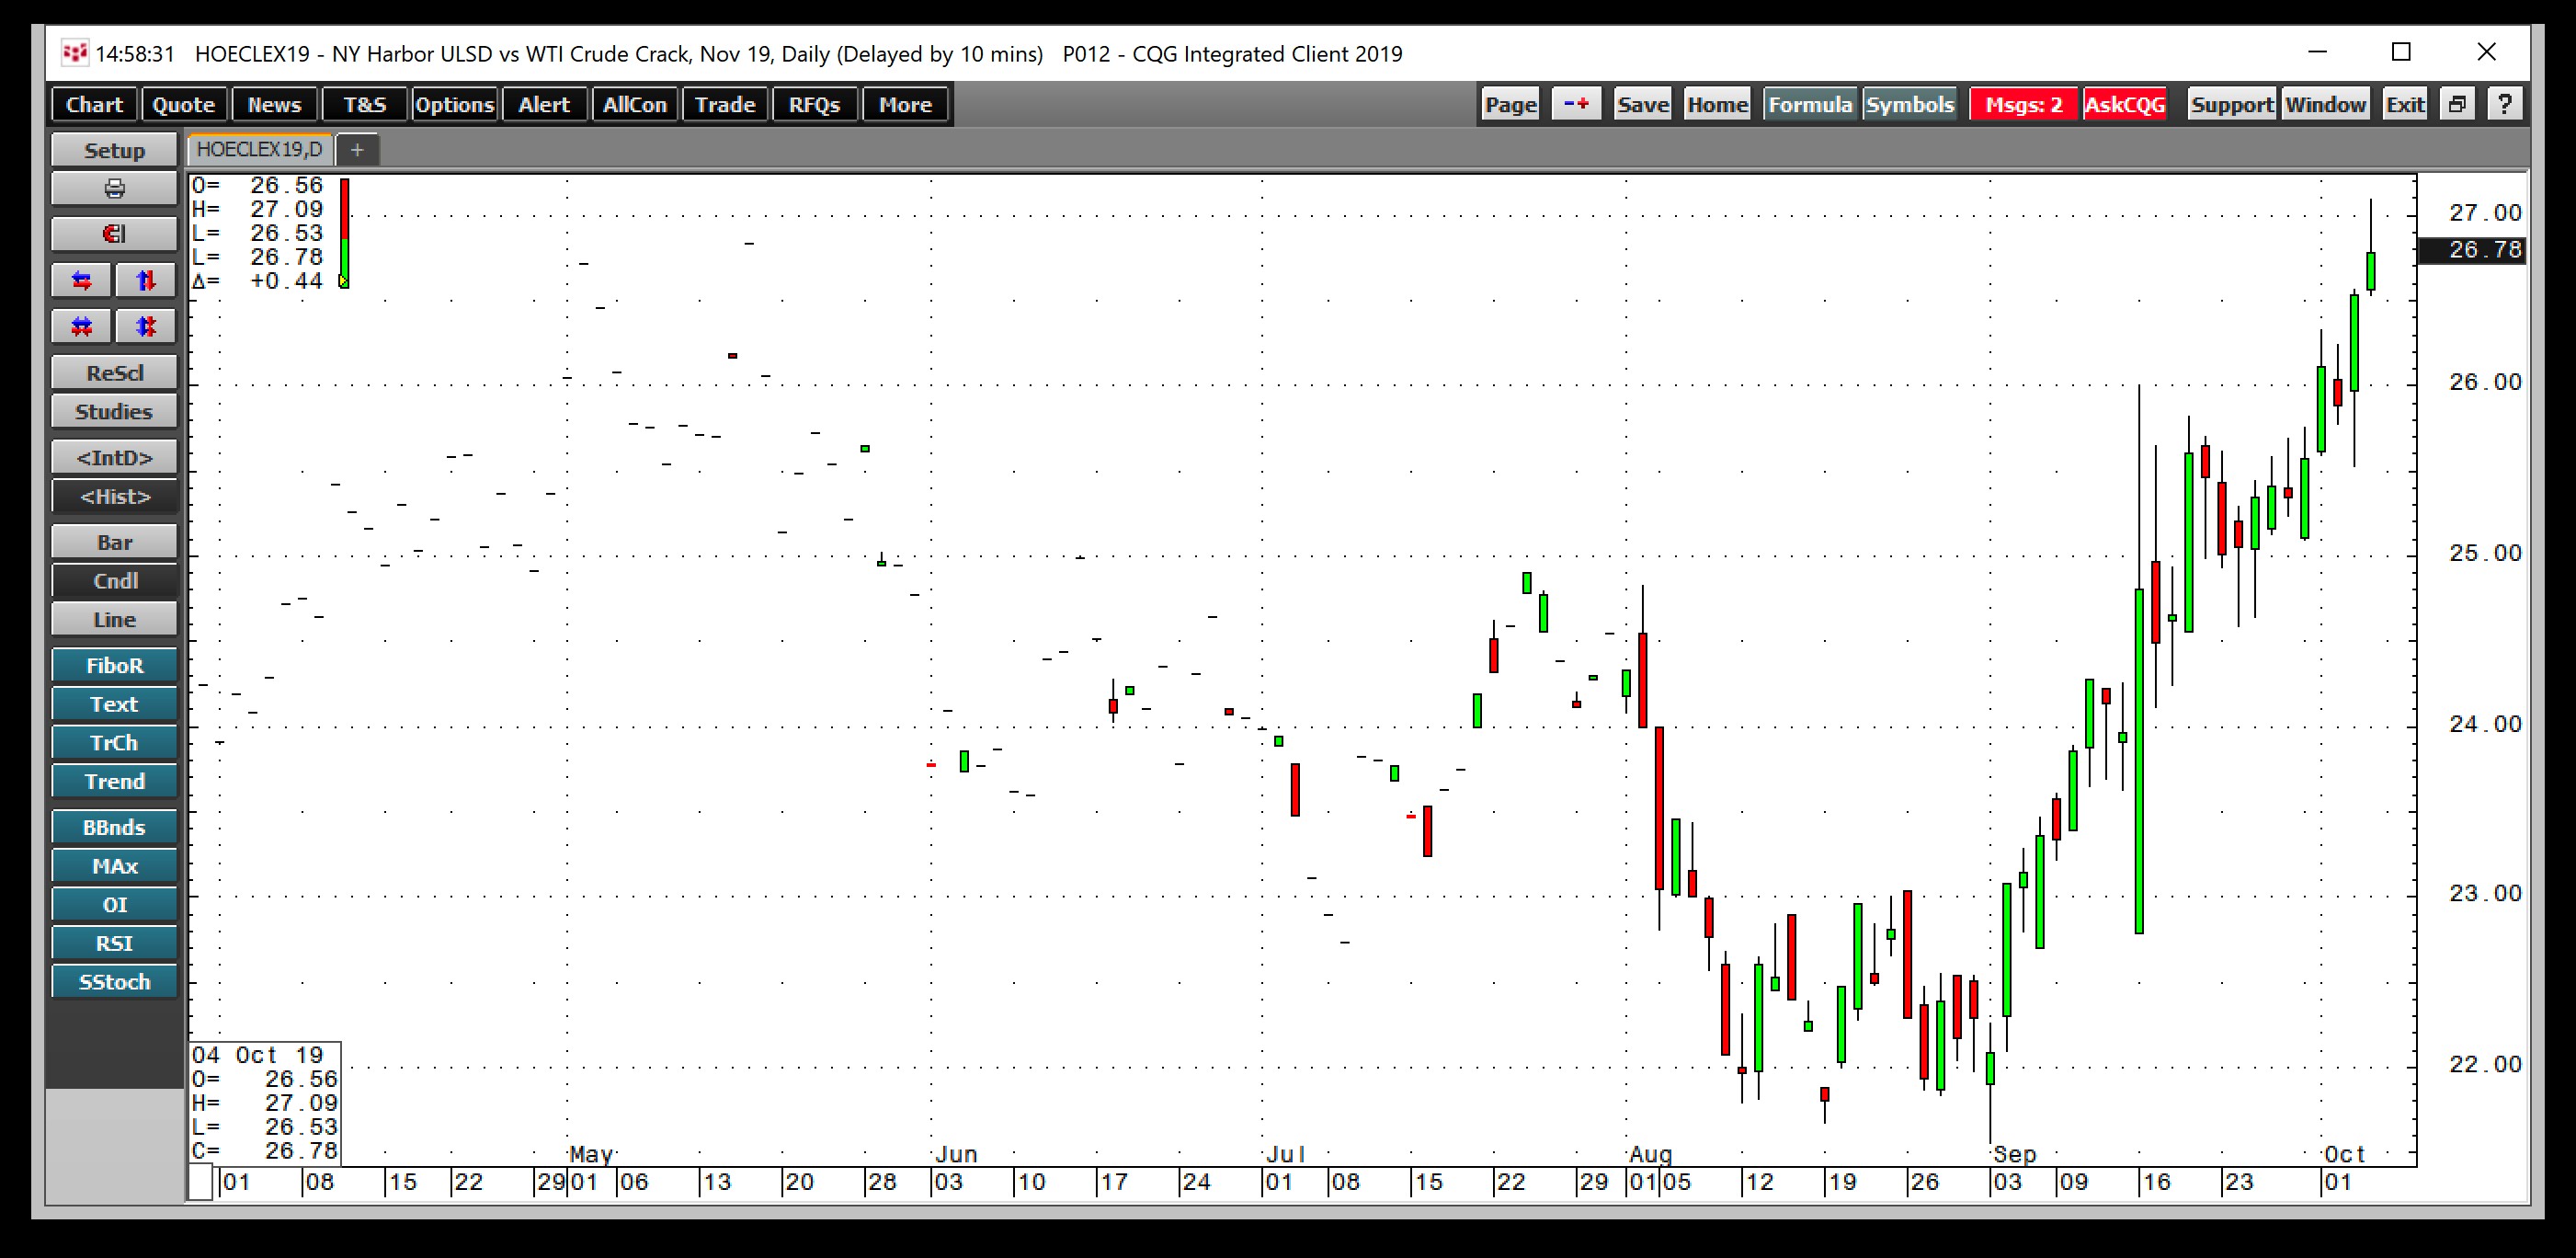
The Heating Oil Futures contract is a proxy for other distillates like diesel and jet fuels. As the chart shows, the heating oil crack spread increased from $21.56 on September 3 to a high of $27.09 per barrel last Friday. The heating oil processing spread closed the week at just under the $27 per barrel level.
The rise in crack spreads tells us that demand for oil products remains robust as product prices have outperformed the raw crude oil price. Inventory data, the price action in crude oil and oil products continue to provide conflicting signals for the direction of the crude oil market.
Last year, the fourth quarter was a bearish time of the year for the oil market. When it comes to the coming months, fasten your seatbelts as Iran, and conflicting data could make volatility the best bet.
