Depending on the selection of indexes, fund products, and time periods, you can find almost anything you want. Data mining issues aside, the notion of what’s often called the “sweet spot” in the capitalization spectrum persists, albeit in fits and starts. A popular explanation is that the middle slice of the capitalization spectrum merges the best attributes of small caps and large caps while minimizing the drawbacks. The implication: you should carve out a dedicated mid-cap allocation. Perhaps, but like every other risk premium, the mid-cap variety waxes and wanes.
In the search for the mid-cap edge Professor Ken French’s database is an obvious place to start. These numbers certainly favor mid caps vs. large caps through time. Over the last half century, mid-caps beat large caps by a sizable margin in annualized performance terms—12.1% vs. 9.6% through this past August. Over the last decade, however, the spread has narrowed—9.8% vs. 8.1%. Is that a clue that the secret’s out and expected return for mid caps will be lower?
Meantime, how does the mid-cap premium compare by way of real-world investing? In search of an answer, let’s crunch the numbers on a set of ETFs:
- iShares Russell 1000 (large cap) (N:IWB)
- iShares Russell Mid-Cap (N:IWR)
- iShares Russell 2000 (small cap) (N:IWM)
- iShares Micro-Cap (N:IWC)
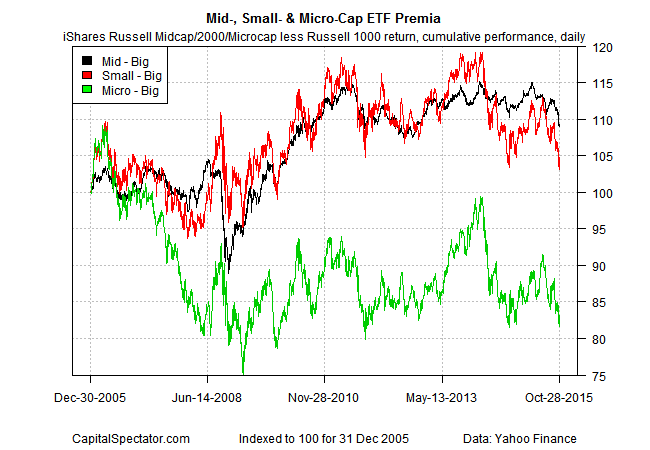
One way to measure premia is by calculating the daily return spread between two assets and tracking the cumulative change. By that standard, the small- and mid-cap ETFs have earned a moderate premium over large-cap equities. Micro-caps, by contrast, have trailed large-caps and by more than a trivial degree.

While there appears to be excess return associated with small- and mid-cap stocks vs. large caps in the ETF proxies above, the premia has been fading lately. Note too that the small- and mid-cap premia have been roughly equivalent over the last ten years but the small-cap version is considerably more volatile. That’s a sign that mid-caps appear to offer a premium on par with small-caps but with less risk.
Is that a free lunch? Probably not, or at least it’s premature to proclaim as much based on the numbers above. Looking for convincing evidence of a mid-cap premium requires deeper analysis, perhaps across a range of ETFs and different indexes. Indeed, one of the factors that’s warm and fuzzy in mid-cap analysis is defining terms. Professor French, for instance, targets the middle 40% of capitalization deciles as a measure of mid cap. That’s a reasonable definition, but it’s not obvious that’s its optimal. The obvious question: how would different definitions fare?
Definitions can have a big impact in the mid-cap space. Consider the trailing 1-year return for the Schwab US Mid-Cap ETF (N:SCHM) vs. the iShares Russell Mid-Cap (IWR). The Schwab fund’s ahead by 6.69% for the year through yesterday (Oct. 28)—a solid edge of more than 200 basis points over IWR’s 4.53% increase for the trailing 12-month period, according to Morningstar.com. Why the difference? The choice of the target index probably plays a role. IWR’s tracking the Dow Jones U.S. Mid-Cap Total Stock Market Index vs. the Russell Mid-Cap for IWR.
The bottom line: the details matter in mid-cap land, perhaps a lot. That’s another way of saying that if you torture the concept of mid-cap investing long enough, you can force it to say almost anything you want. That doesn’t mean we should steer clear, although it’s essential to go in with eyes wide open.
