Central Banks Provide Headwind For Bears
If you have been around the financial markets for any length of time, you are familiar with the expression don’t fight the Fed. The corollary is don’t fight global central banks when they are injecting new cash into the global financial system. As we noted on October 25, the Fed was draining liquidity from the system leading up to the October 2007 peak in stocks (see table below). In 2013, the Fed is injecting liquidity.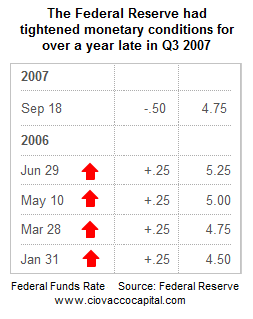
November 2013: Talk Is Of More, Not Less
The European Central Bank on Monday continued to hint at adding more, rather than less, liquidity to the system. From Bloomberg:
European Central Bank Governing Council member Ardo Hansson said the ECB stands ready to cut borrowing costs further and is technically prepared to make its deposit rate negative. “The options on rate cuts are still not fully exhausted and there are all kinds of other measures that are still on the table,” Hansson said in an interview in Tallinn on Nov 22. “Of course, every time you use one option, you have one less to use. But I don’t see us, by any means, running out of our toolkit of things we can draw on.”
Aligning With Economic Bias Is Key
Financial markets adhere to the principle of fractals, which means they behave the same way when viewed in various time frames. The same concepts used by a short-term trader looking at a 10-min chart of the S&P 500 apply to a daily, weekly, and monthly chart. Asset prices are determined by the law of supply and demand, or the balance of power between bullish economic conviction and bearish economic fear. Common sense tells us that when the bias of short-term traders, intermediate-term investors, and long-term investors are aligned, it represents a more powerful form of conviction. Since our focus is longer-term (investing), rather than shorter-term (trading), we will focus on daily, weekly, and monthly charts, rather than 1-min, 10-min, and 60-min charts.
The Best And Worst Of Times
All technical analysis speaks to probabilities. The best time to short, from a probabilistic perspective, is when the bias in multiple time frames is bearish on the economy and earnings. The worst time to short stocks is when the bias in multiple time frames is bullish. 
2008: High Probability Short – Daily
A bearish trend in stocks tells us a lot about the aggregate interpretation of the economy. When stock prices make a series of lower highs and lower lows (a downtrend), it means bearish economic conviction is stronger than bullish economic conviction. An investor, or trader, looking at the chart below in 2008 would have erred on the side of selling short, rather than going long (owning stocks).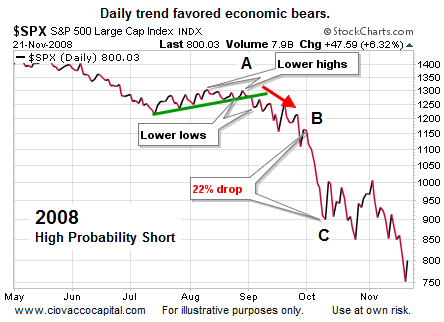
2008: High Probability Short – Weekly
Regular readers know the CCM Market Model relies heavily on weekly charts to determine the market’s aggregate tolerance for risk. Therefore, if we were looking at the chart below in 2008, our bias would have aligned with the bearish case.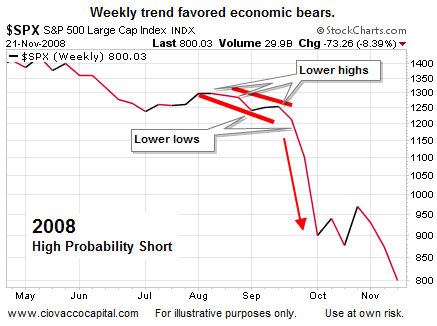
2008: High Probability Short – Monthly
An investor, with a longer time frame, reviewing the monthly chart of the S&P 500 below would also draw bearish conclusions from the series of lower highs and lower lows, marking a bearish long-term trend.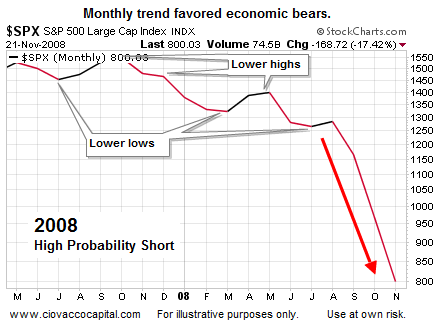
2013: Low Probability Short – Daily
Last week, the S&P 500 dropped on Monday, Tuesday, and Wednesday. The bias of some short-term traders flipped quickly to the bearish end of the spectrum. Was last Tuesday a prudent time for investors to “go short” or buy the inverse S&P 500 ETF (SH)? If we shorted last Tuesday, the odds would have been against us from a daily perspective since the trend still clearly favored bullish economic conviction over bearish economic conviction. The series of higher highs and higher lows (an uptrend) told us the market’s aggregate bias still favored “buying the dip” rather than “shorting on weakness”.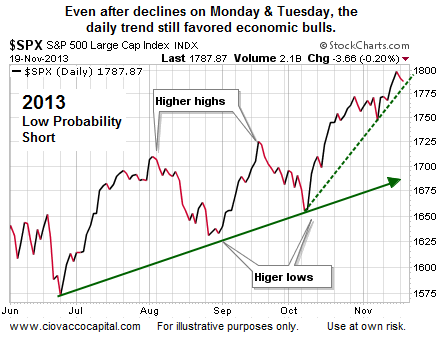
2013: Low Probability Short – Weekly
If we examine the current battle between bullish economic conviction and bearish economic conviction from a weekly perspective, it says a short position is a bet against the primary bullish trend.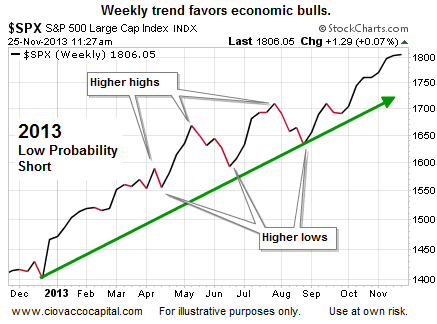
2013: Low Probability Short – Monthly
The table above told us the “worst time to short” from a probabilistic perspective was when the daily, weekly, and monthly charts all aligned in a bullish manner, which is the market’s current profile, and the profile that was present during the normal “give back” last Monday, Tuesday, and Wednesday.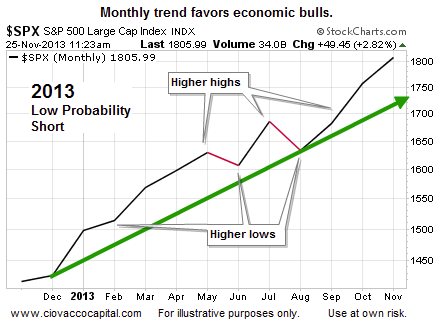
Valuations: Not Cheap, But Not Outlandish
On November 4 we provided hard evidence showing earnings multiples could expand further based on recent history. A famous bubble watcher weighed in on the subject last Friday. From MarketWatch:
Wharton professor Jeremy Siegel spoke on a live webcast Friday about stock valuation, saying that when interest rates are lower than 8%, U.S. equities, as measured by the S&P 500, have averaged a price-to-earnings ratio of 19. That P/E ratio implies a fair-market value for the S&P 500 of over 2,000 based on this year’s combined earnings. That’s 10% to 13% higher than the index’s current levels. “We are still at extremely normal, average valuations and, in fact, low valuations, given the interest-rate environment and even the anticipated rise in interest rates,” Siegel said.
Investment Implication – Aggregate Opinion Remains Optimistic
The series of higher highs and higher lows on the daily, weekly, and monthly charts tell us the answer to the question should investors be shorting stocks instead of buying is “no, not from a probabilistic perspective”. Last week’s article, 3 Ominous Bear Market Signals, also aligns with the “this is not a high probability entry point for investors to short stocks” case. The message from the market’s pricing mechanism in 2013 is much more favorable for stocks than it was in 2007/2008. If economic data, Fed policy, and/or weak earnings result in a shift in the aggregate tolerance for risk, we must adjust our exposure to stocks in an appropriate manner. As long as the message is one of expectation for positive economic outcomes, we will continue to hold our positions that were established between October 9 and October 18, including broad U.S. exposure (VTI), technology (QQQ), financials (XLF), energy (XLE), foreign stocks (EFA), and emerging markets (EEM).
