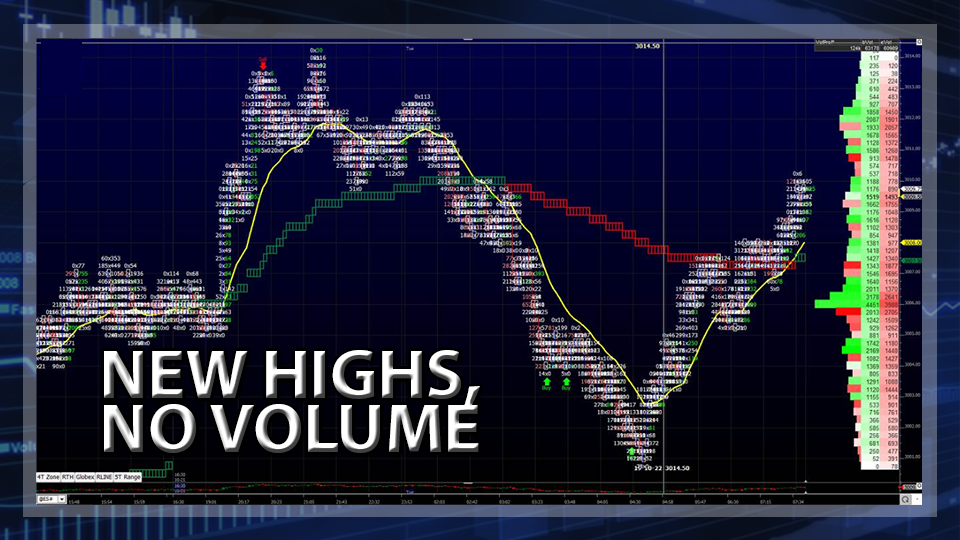
ES Grinding Higher
The S&P 500 futures (ESZ19:CME) settled at 3004.75 yesterday, about eight points above its opening print of 2996.48 and at the upper end of its trading range (2995.35 – 3007.33), after closing last week at 2986.20. Holding the 3000 level was important but a twelve point trading range leaves something to be desired.
The following charts from AMS are what we use daily. Feel free to email me at david@amstrdinggroup.com if you have any questions about them. They work for us and will work for you as well once you take the time to learn.
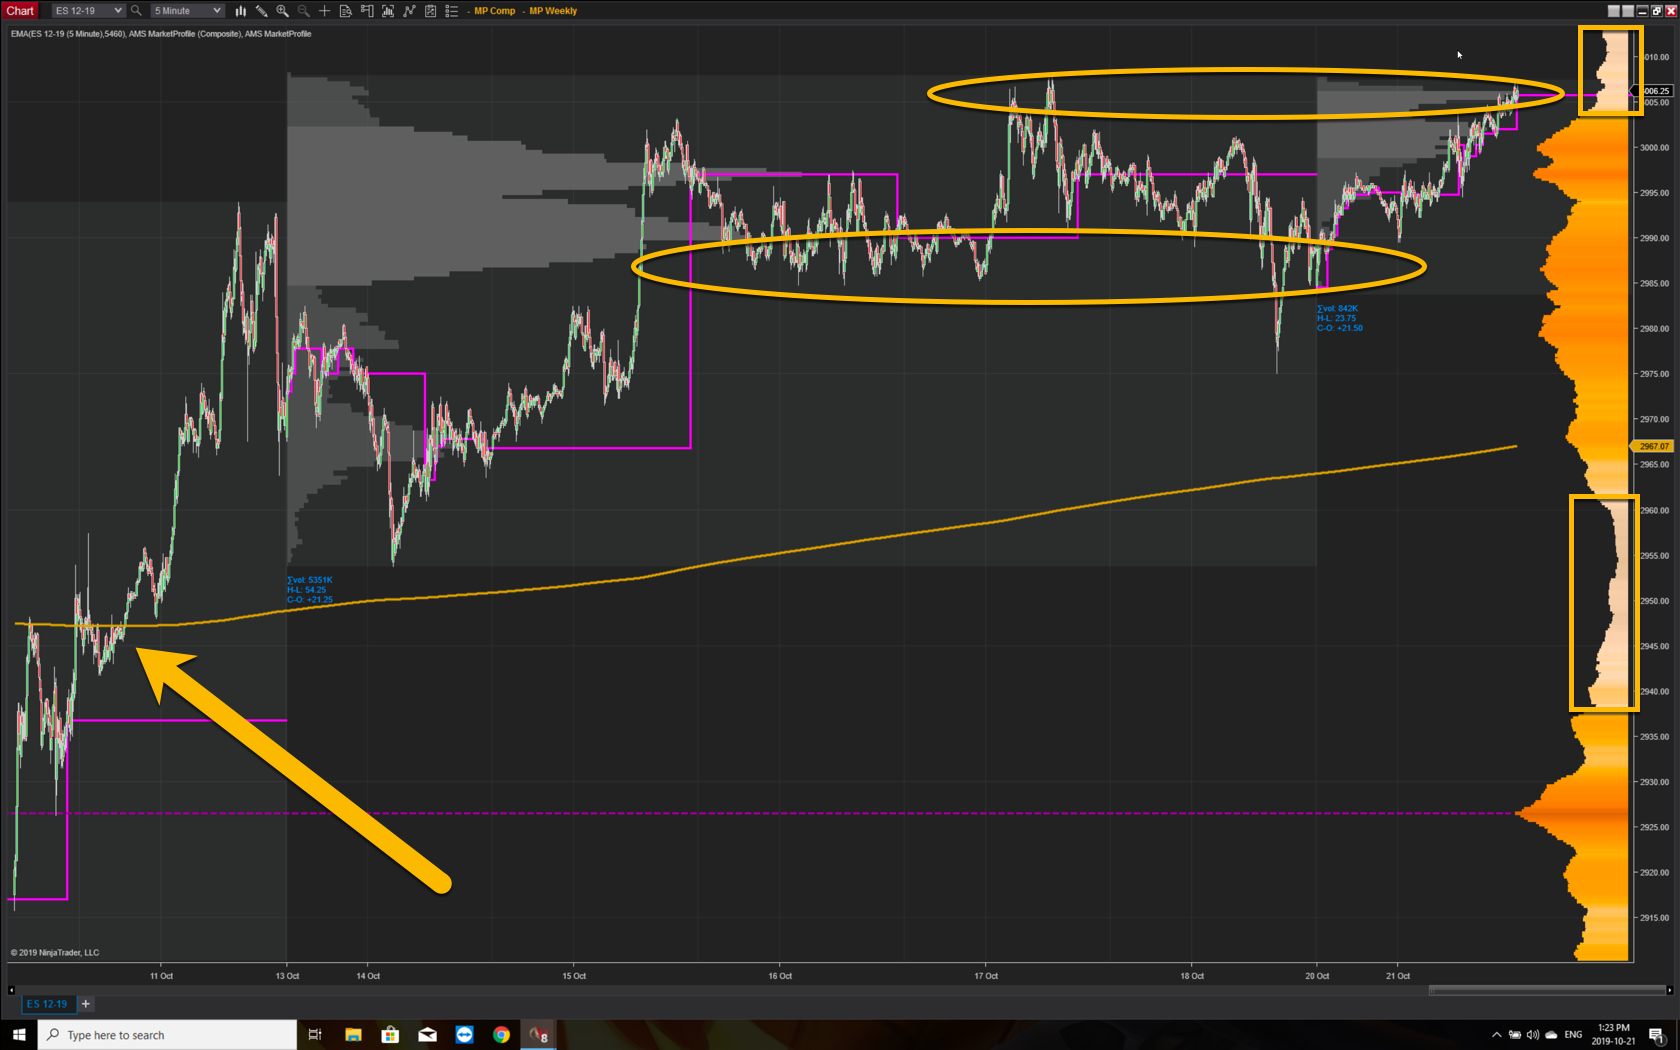
Chart courtesy of AMS Trading Group
Chart courtesy of AMS Trading Group
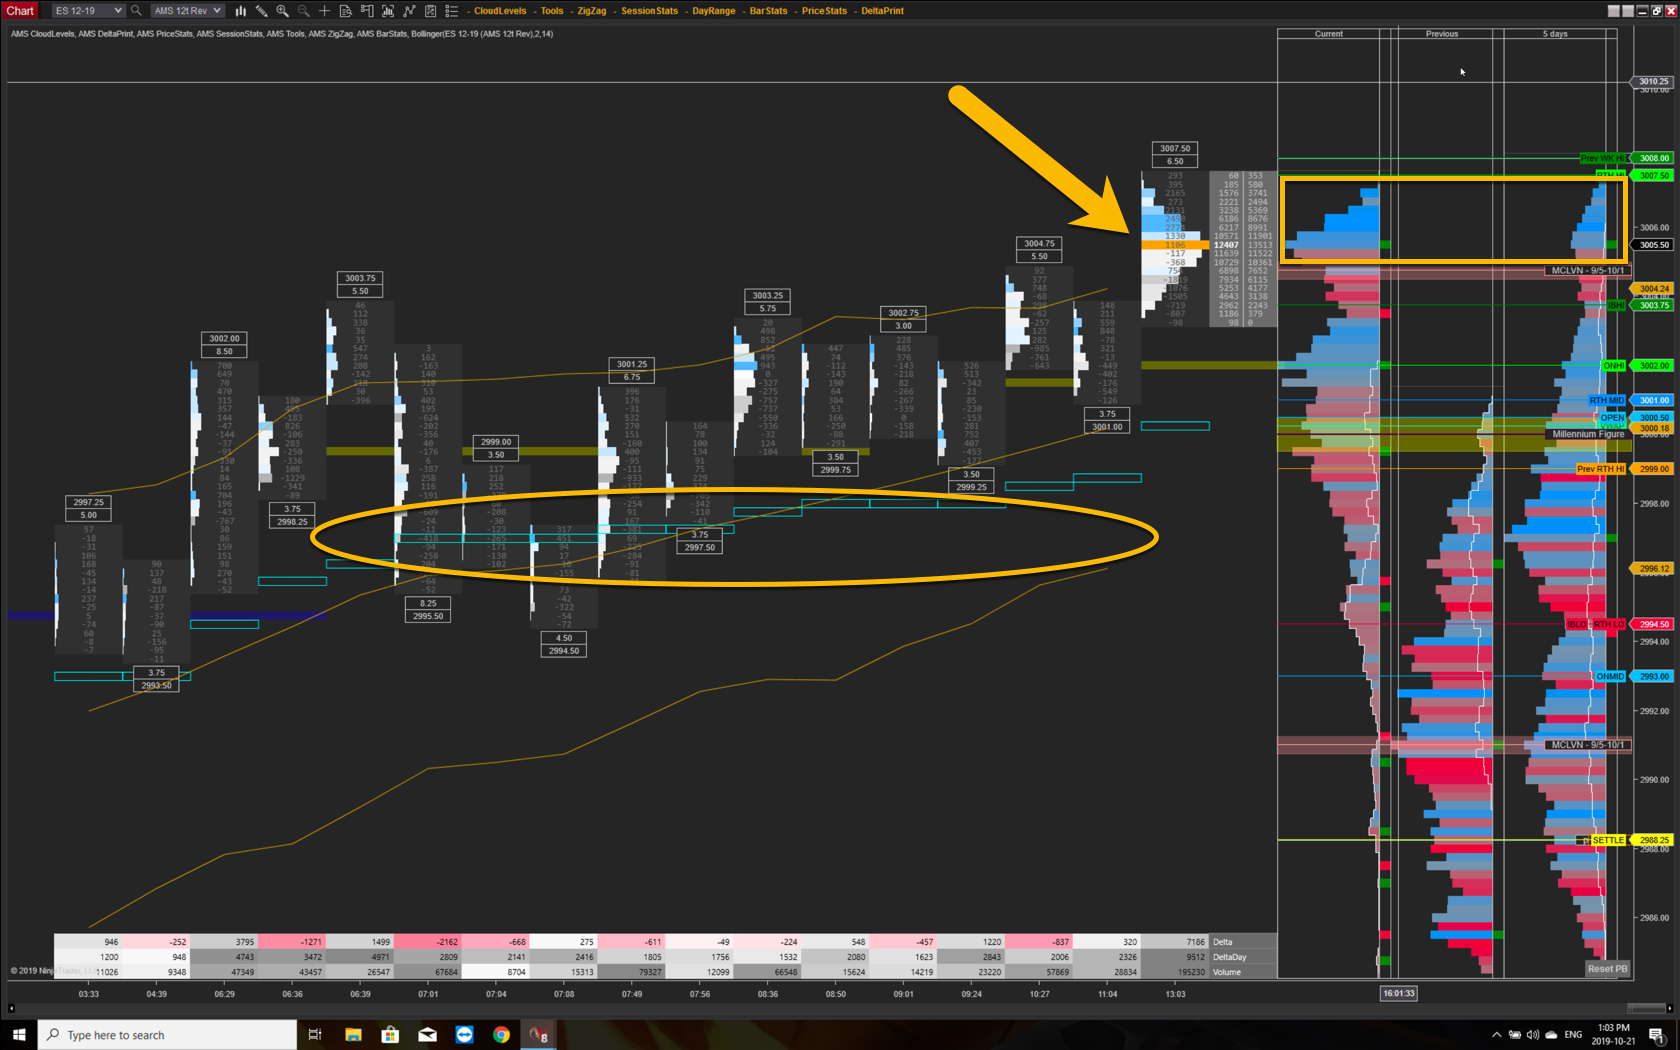
Chart courtesy of AMS Trading Group
Earnings Hits and Misses
Analysts agree, earning estimates are too high, and it’s time to start doing something about it. They always underestimate, so there’s usually a “pop”. Estimates for last week declined, just as they did in late 2018, and earlier this year. It was not a pleasant fourth quarter last year, and weak estimates are primarily what precipitated the decline. That doesn’t mean earnings are headed into negative territory, but they are declining, or rather, not growing as fast as they did.
Despite the fact that 81% reporting companies beat their estimates (I question most analysts’ estimates for this reason), those that miss, like IBM (NYSE:IBM), get crushed. While the Federal Reserve’s position on interest rates has become more favorable, rates often decline before underlying economic conditions decline, at least that’s the way it’s supposed to happen. It’s only a matter of time before the markets react if growth becomes selective. We’ve all seen it before, it’s called a TOP!
A Word On Trade and Volatility
With respect to volatility, despite the market’s gains yesterday, increases in the daily range did not follow suit. What is somewhat reassuring to the bulls is that the test came on the upside over 3000 and not below 2993, an area of support that has become critical (see charts above). The usual macroeconomic uncertainties remain intact, with nothing out of the ordinary expected. Tariffs reduce the amount of money in circulation.
Global trade decreases when entities like China and the United States do battle, exhibited by the lackluster results out of South Korea. It’s time to create assurances that the battles have been fought, and so far no one has won the trade war.
Charts
The “widow maker” is doing it’s thing. Natural Gas bottoms are printing like clockwork, as reflected further by today’s trading range testing out the lower levels of recent months. Remember, we are looking for a point of entry, so we have not yet initiated a position. When we do, using the current month’s technical, we will trade using NG 02-20 (February 2020), a policy we have utilized for years.
We will continue to post the charts we use to make such a decision in hopes that we can teach how to use the AMS platform. Just email me at david@amstradinggroup.com for more information.
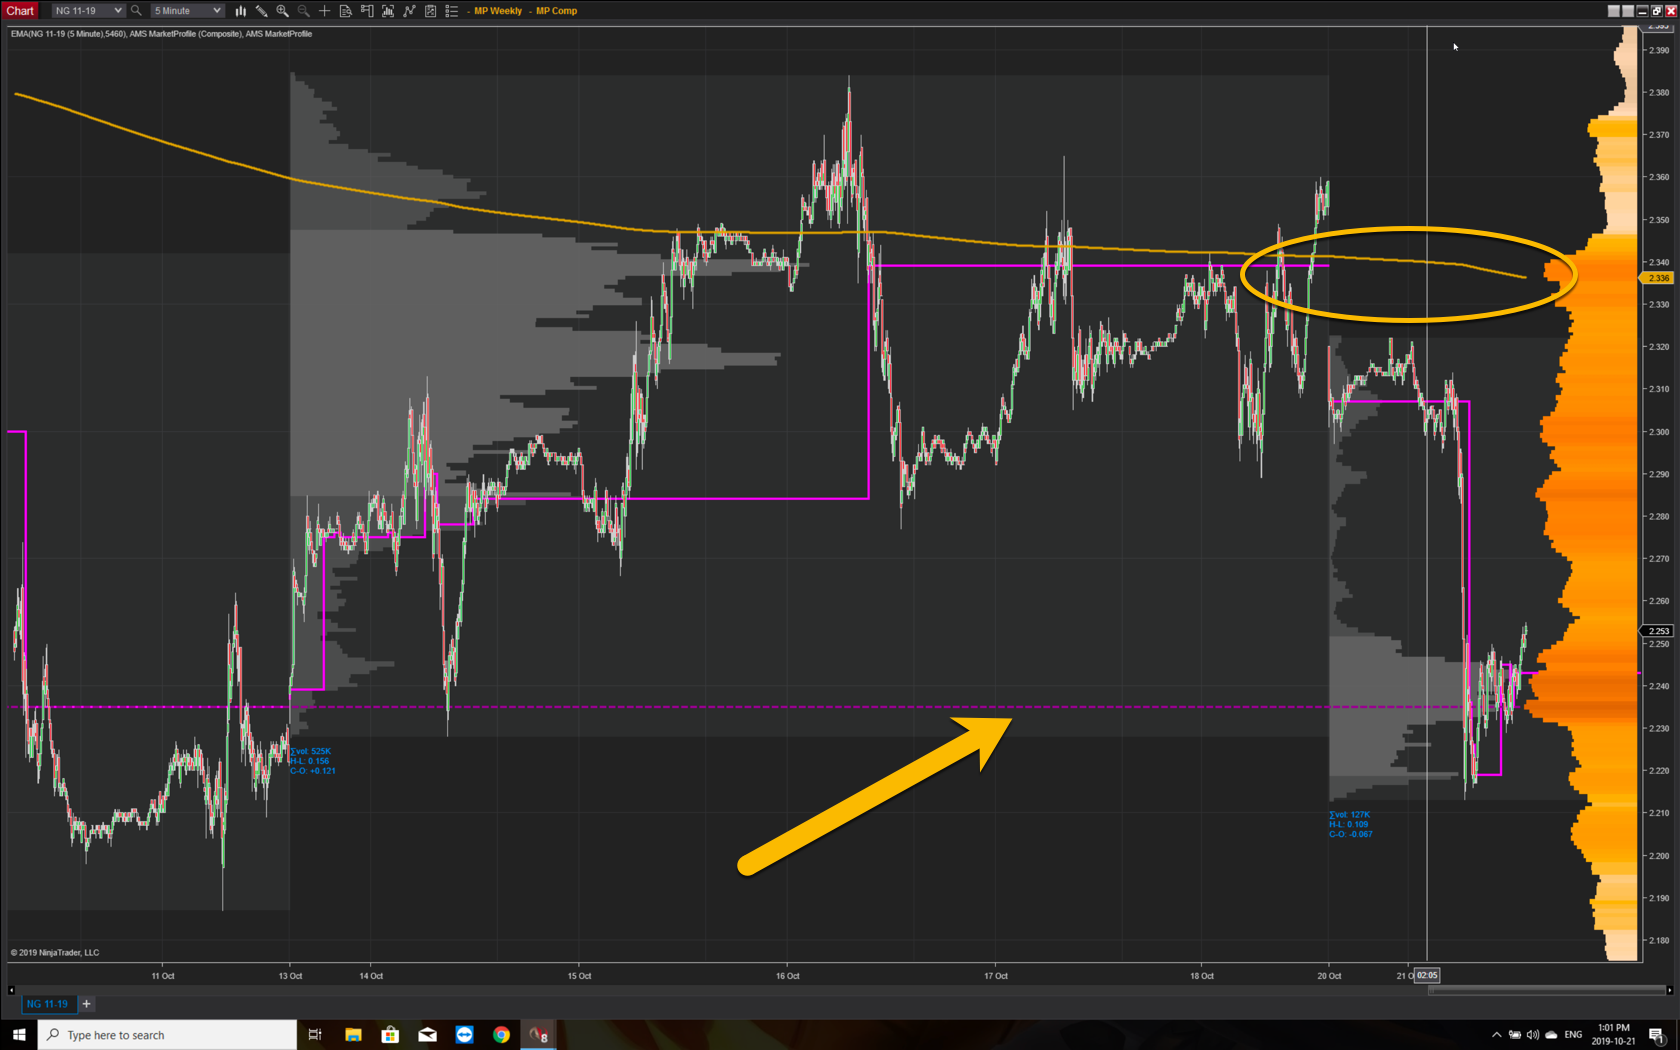
Chart courtesy of AMS Trading Group
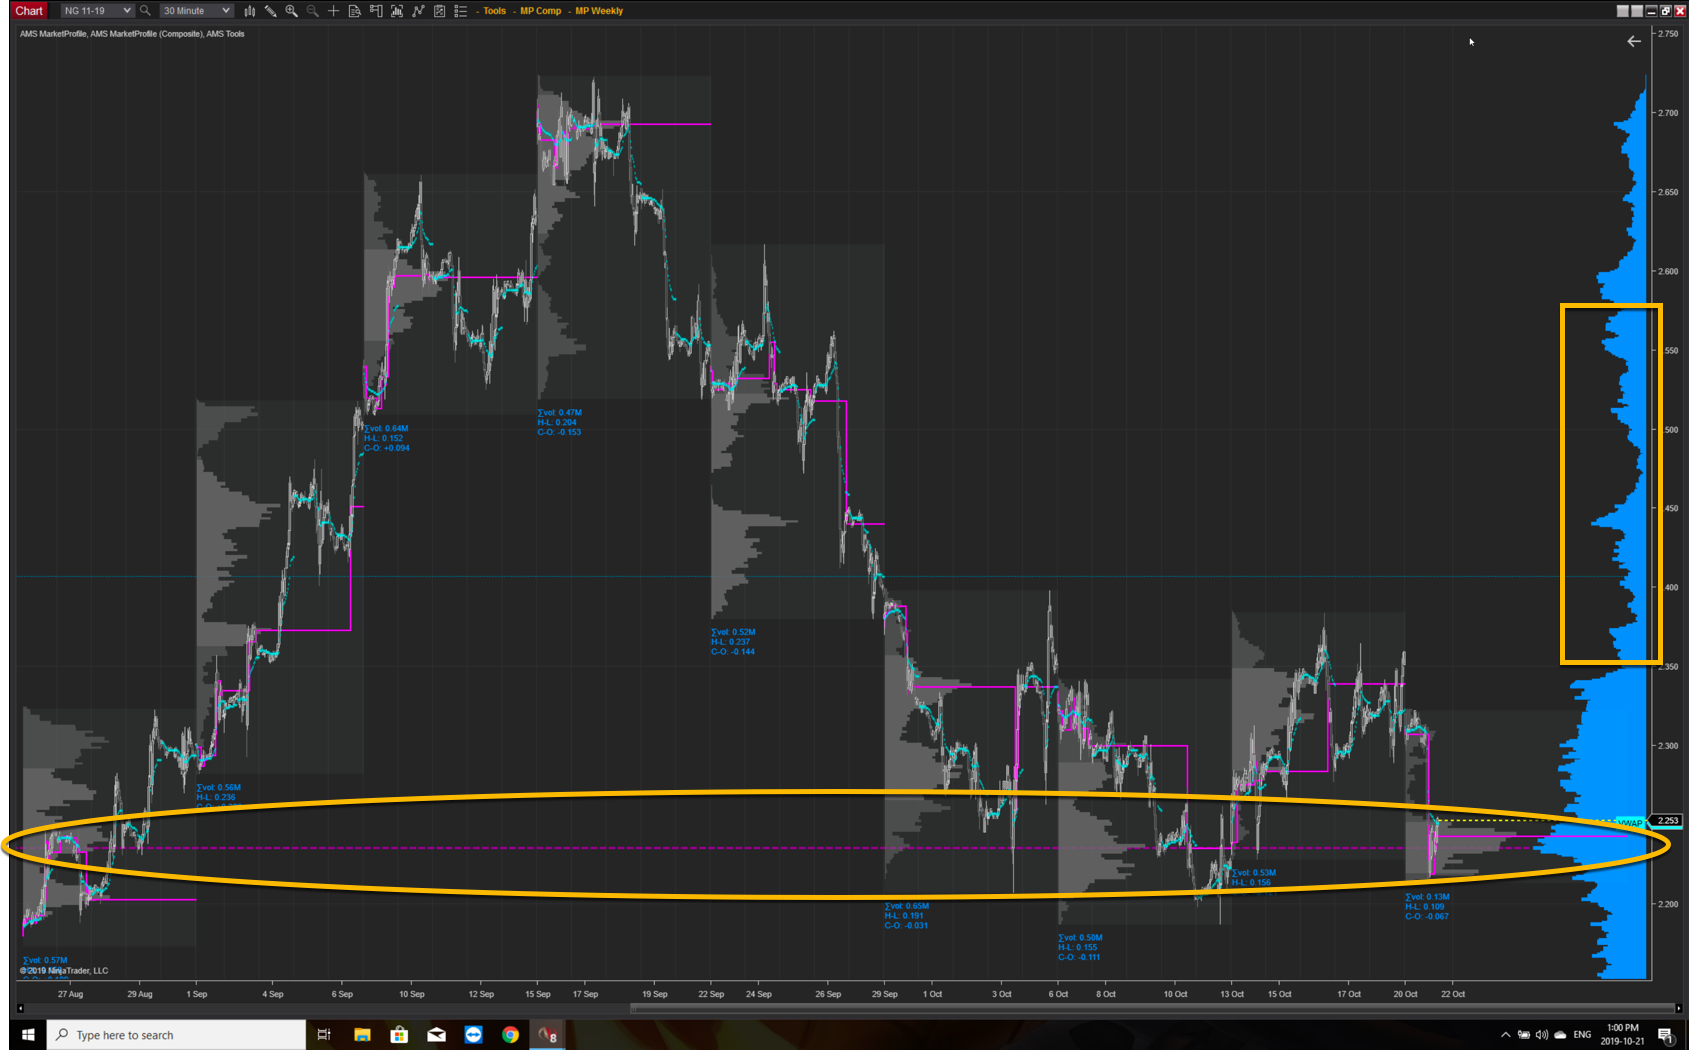
Chart courtesy of AMS Trading Group
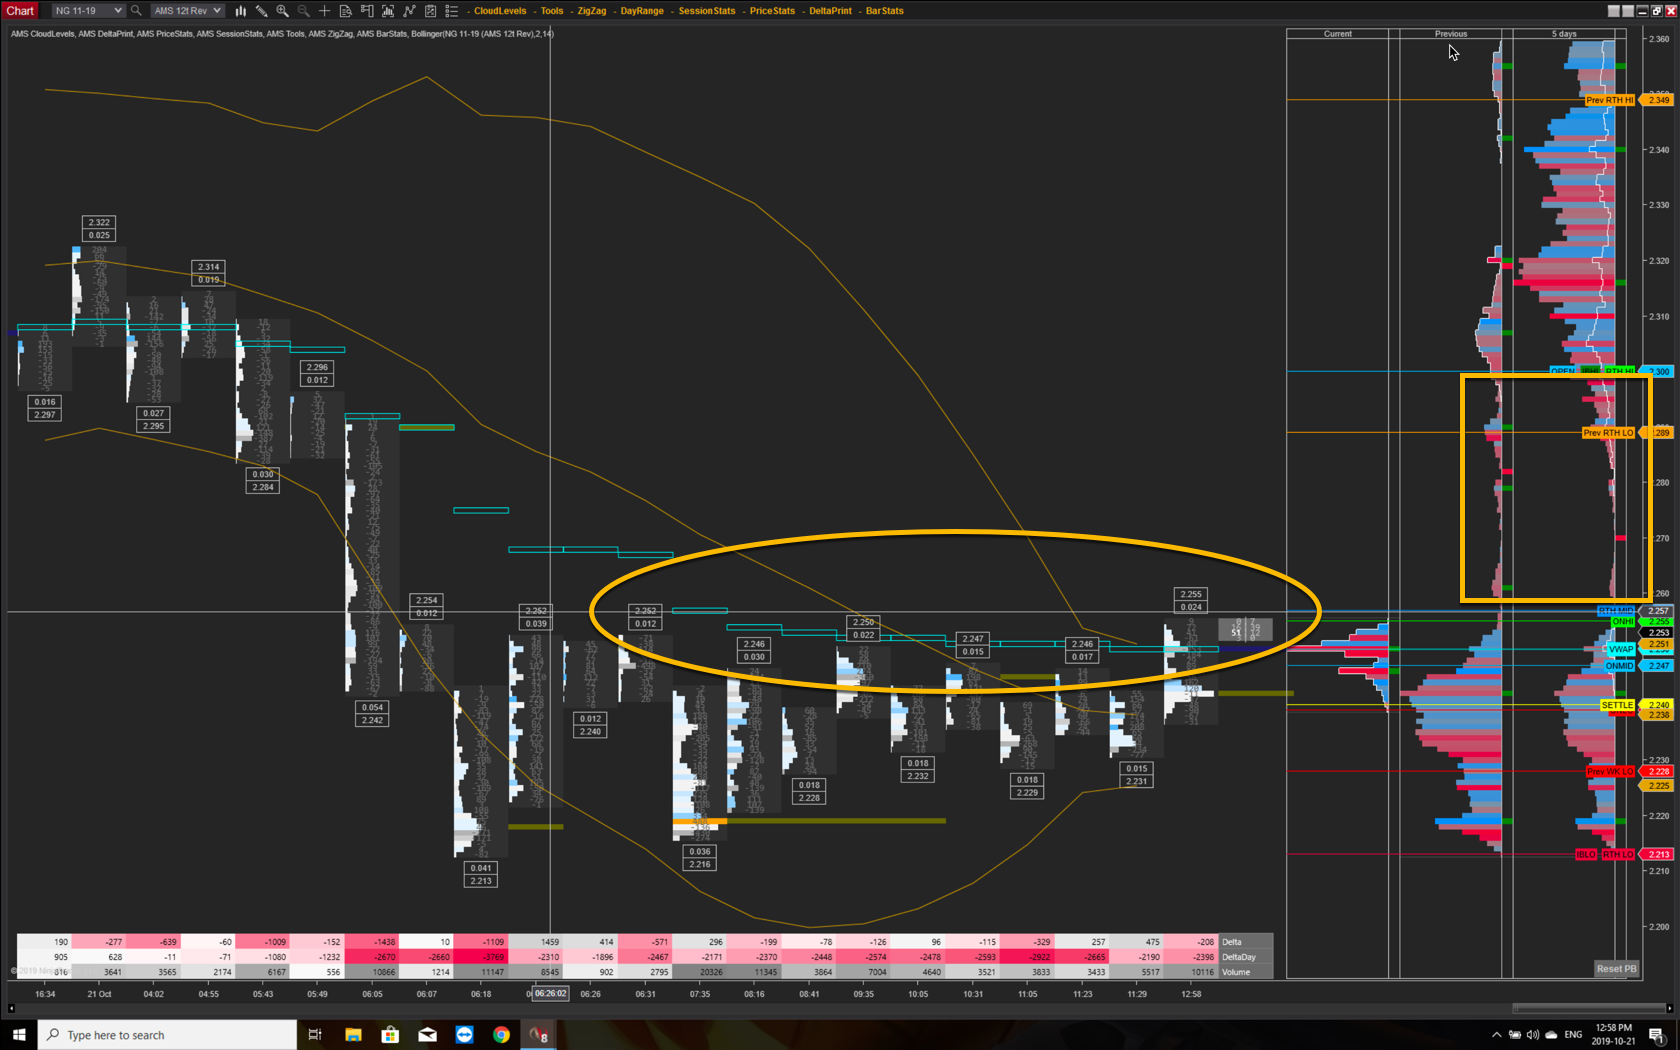
Chart courtesy of AMS Trading Group
The first two charts are from MarketProfile; one a couple months long and the other a couple weeks. In the second, a cross of the twenty (20) day moving average would be nice, especially with the contract price heading towards a low volume node above where it is currently trading.
