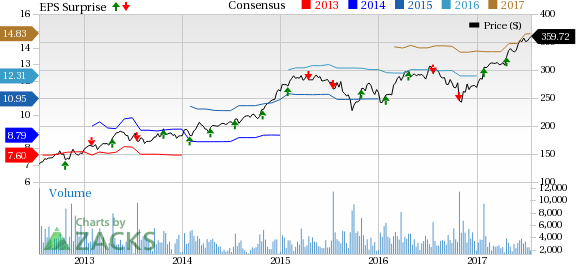
Sherwin-Williams (NYSE:SHW) logged profits of $319.1 million or $3.36 per share for the second quarter of 2017, down roughly 16% from $378.1 million or $3.99 per share a year ago. The bottom line was hit by charges associated with the buyout of Valspar. Sherwin-Williams wrapped up its $11.3 billion acquisition of Valspar on June 1.
Earnings, barring one-time items including acquisition-related costs, came in at $4.52 per share, missing the Zacks Consensus Estimate of $4.54. The company recorded charges of 72 cents per share for acquisition-related costs and charges of 44 cents per share related to the sale of Valspar's North American Industrial Wood Coatings business assets.
Sherwin-Williams recorded net sales of $3,735.8 million in the quarter, marking a 16% year-over-year rise. Revenues beat the Zacks Consensus Estimate of $3,571.9 million. Sales from stores in the U.S. and Canada (open more than 12 calendar months) rose around 5% in the quarter.
Segment Review
Sherwin-Williams made changes to its reporting structure as a result of its acquisition of Valspar that led to the formation of three new reportable operating segments – The Americas Group, The Consumer Brands Group and The Performance Coatings Group.
The Americas Group unit registered net sales of $2.44 billion in the reported quarter, up around 9% on a year over year comparison basis. Revenues were driven by increased architectural paint sales volume in most end markets, the impact of the change in revenue classification and higher selling prices. The company opened 33 net new store locations during the first six months.
Net sales of the Consumer Brands Group unit went up 16% to $536.4 million, driven by the addition of Valspar sales for the month of June, partly masked by reduced volume sales to most of the unit’s retail and commercial customers. Valspar sales increased the division’s net sales by around 28% in the quarter.
Net sales from the Performance Coatings Group jumped 48% to $761.1 million in the quarter on the back of one-month of Valspar sales, increased paint sales volume and higher selling prices. Valspar sales contributed roughly 49% to the segment’s net sales in the quarter.
Financials and Shareholder Returns
Sherwin-Williams made no open market purchases of its common stock during the six months ended Jun 30, 2017. At the end of the second quarter, the company had cash on hand of $210 million that it plans to use to reduce debt.
Outlook
Moving ahead, Sherwin-Williams said that it will focus on boosting the performance of its core businesses while completing the Valspar integration.
The company sees low to mid-single digit percentage increase in net sales, year over year for third-quarter 2017. The company expects earnings per share in the third quarter to be in the range of $3.70 to $4.10 per share, compared to $4.08 earned in the third quarter of 2016. Third-quarter earnings per share includes a $1.10 per share charge associated with the Valspar acquisition.
For full-year 2017, Sherwin-Williams projects mid-single digit percentage increase in net sales from 2016. It also sees incremental sales from the Valspar buyout to be around $2.4 billion for the year. At this level, the company now expects earnings per share from continuing operations for the year to be in the range of $12.30 to $12.70 per share, compared with $11.99 earned in 2016. The guidance includes a $2.50 per share charge related to the Valspar acquisition.
Price Performance
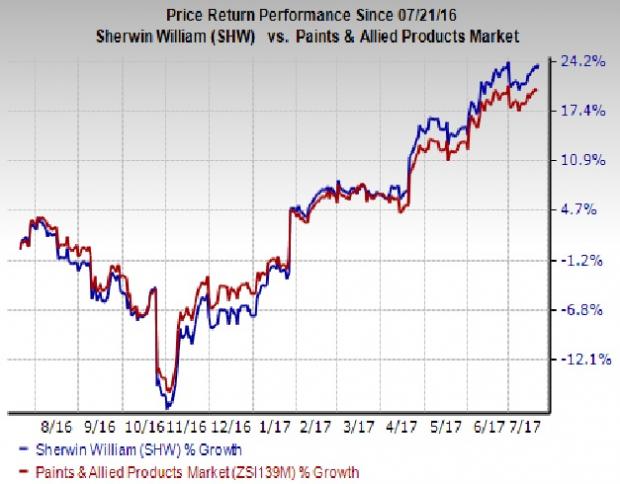
Sherwin-Williams’ shares rallied around 23.8% over the past one year, outperforming the Zacks categorized Paints & Allied Products industry’s roughly 20% gain.

Zacks Rank & Other Stocks to Consider
Sherwin-Williams currently carries a Zacks Rank #1 (Strong Buy).
Other well-placed companies in the basic materials space include Westlake Chemical Corporation (NYSE:WLK) , The Chemours Company (NYSE:CC) and Ternium S.A. (NYSE:TX) , all sporting a Zacks Rank #1. You can see the complete list of today’s Zacks #1 Rank stocks here.
Chemours has an expected long-term earnings growth of 15.5%.
Westlake has an expected long-term earnings growth of 7.2%.
Ternium has an expected long-term earnings growth of 18.4%.
3 Top Picks to Ride the Hottest Tech Trend
Zacks just released a Special Report to guide you through a space that has already begun to transform our entire economy...
Last year, it was generating $8 billion in global revenues. By 2020, it's predicted to blast through the roof to $47 billion. Famed investor Mark Cuban says it will produce "the world's first trillionaires," but that should still leave plenty of money for those who make the right trades early. Download Report with 3 Top Tech Stocks >>
Chemours Company (The) (CC): Free Stock Analysis Report
Westlake Chemical Corporation (WLK): Free Stock Analysis Report
Sherwin-Williams Company (The) (SHW): Free Stock Analysis Report
Ternium S.A. (TX): Free Stock Analysis Report
Original post
Zacks Investment Research

