Europe’s largest oil company Royal Dutch Shell (LON:RDSa) plc RDS.A reported strong second-quarter results, as its upstream business swung to a profit on rebounding oil prices and refining operations remained robust amid successful cost containment efforts.
Shell is the first integrated supermajor to come out with second quarter results. Continental rival BP plc (NYSE:BP) is scheduled to report numbers next week, while U.S.-based Chevron Corp. (NYSE:CVX) and ExxonMobil Corp. (NYSE:XOM) will release June-quarter earnings tomorrow.
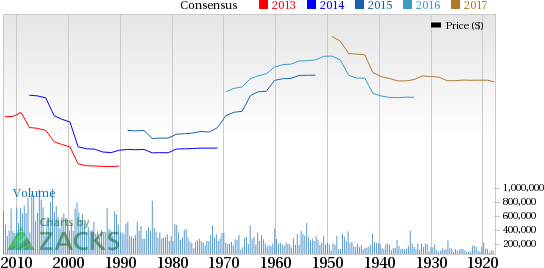
The Hague-based Shell reported earnings per ADS (on a current cost of supplies basis, excluding items) of 88 cents, breezing past the Zacks Consensus Estimate of 75 cents and the year-ago adjusted profit of 26 cents.
Revenues of $72,702 million were 21% above the second-quarter 2016 sales of $60,271 million. Meanwhile, operating expenses fell in the quarter, coming in at $9,548 million, compared to $11,546 million in the second quarter of 2016.
Segmental Performance
Upstream: Upstream segment recorded a profit of $339 million (excluding items) during the quarter, turning around from the $1,325 million (adjusted) loss in the year-ago period.
This primarily reflects the impact of a rise in production on the back of assets ramping up, higher oil and gas realizations, reduced depreciation charges and better operational performance.
Shell’s upstream volumes averaged 2,672 thousand oil-equivalent barrels per day (MBOE/d), 2% higher than the year-ago period. While crude oil production increased 7%, natural gas output was down 5% - thanks to production from new fields. Liquids contributed approximately 61% to Shell’s total volumes, while natural gas accounted for the remaining portion.
Apart from the obvious BG role, production during the quarter compared with the year-ago quarter included volumes from new field start-ups and continued ramp-up of existing fields – particularly Kashagan in Kazakhstan, Lula Alto, Lula Central, Lula South and Iracema North projects in Brazil and the Stones development in the Gulf of Mexico – that boosted output by roughly 184 MBOE/d and more than offset the impact of field declines.
Shell’s worldwide realized liquids prices were 16% above the year-earlier levels while natural gas prices were up 31%.
Downstream: In the downstream segment, the Anglo-Dutch super-major reported adjusted income of $2,529 million, 39% more than the $1,816 million earned in the year-ago period. The positive comparison reflects the impact of stronger results from chemicals and refining operations, improved operational performance and lower costs.
Integrated Gas: The Integrated Gas unit reported adjusted income of $1,169 million as against $868 million in Apr-Jun quarter of 2016. Results were favorably impacted by increase in commodity prices, higher LNG volumes and decline in operating expenses. Partly offsetting these factors were lower liquids output and thinner trading contribution.
Cash Flow
During the quarter under review, Shell generated cash flow from operations of $11,285 million – the most since the oil price plunge started three years ago – returned $3,900 million to shareholders through dividends and spent $6,766 million on capital projects. The company’s resilient cash generation has helped it to cover dividend payments. Importantly, the group raked in $12,157 million in free cash flow during the second quarter, as against a loss of $3,158 million a year ago.
Balance Sheet
As of Jun 30, 2017, this Zacks Rank #5 (Strong Sell) company had $23,992 million in cash and $90,347 million in debt (including short-term debt). Net debt-to-capitalization ratio was approximately 25.3%, down from 28.1% a year ago following the BG Group acquisition. The improvement in the group’s debt ratio was helped by cost cuts and asset sales (worth $25 billion since 2016).
Share Performance
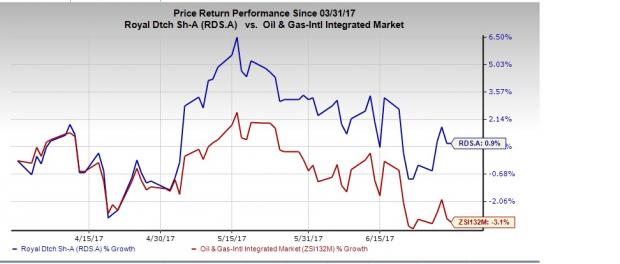
Royal Dutch Shell has gained 0.9% of its value during the second quarter versus the 3.1% decline of its industry.

More Stock News: Tech Opportunity Worth $386 Billion in 2017
From driverless cars to artificial intelligence, we've seen an unsurpassed growth of high-tech products in recent months. Yesterday's science-fiction is becoming today's reality. Despite all the innovation, there is a single component no tech company can survive without. Demand for this critical device will reach $387 billion this year alone, and it's likely to grow even faster in the future. Zacks has released a brand-new Special Report to help you take advantage of this exciting investment opportunity. Most importantly, it reveals 4 stocks with massive profit potential. See these stocks now>>
BP p.l.c. (BP): Free Stock Analysis Report
Chevron Corporation (CVX): Free Stock Analysis Report
Royal Dutch Shell PLC (RDS.A): Free Stock Analysis Report
Exxon Mobil Corporation (XOM): Free Stock Analysis Report
Original post
Zacks Investment Research

