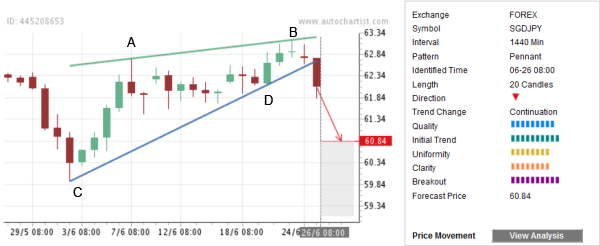
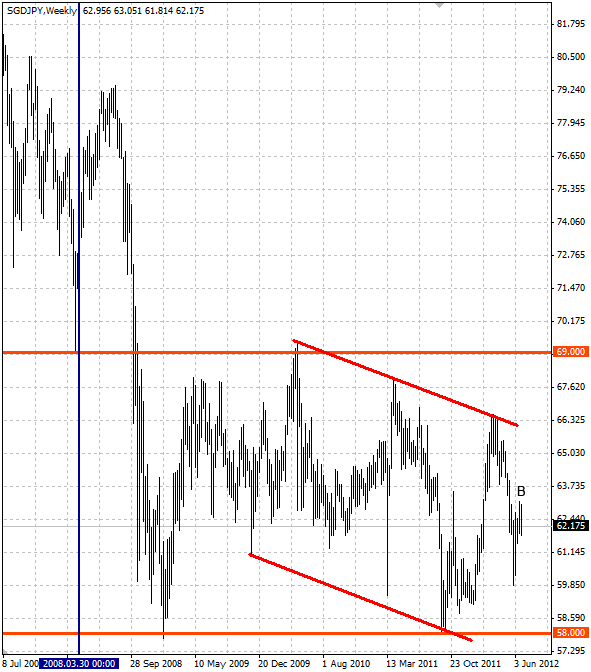
SGD/JPY has recently completed the High Quality Pennant chart pattern identified on the daily charts. The overall Quality of this chart pattern is measured at the high 9 bar level as a result of the maximum Initial Trend (10 bars) and the substantial Uniformity and Clarity (both measured at the 8 bar level). The completion of this Pennant follows the prevailing downtrend that can be seen on the weekly SGD/JPY charts. More specifically, this Pennant follows the preceding sharp daily downward price thrust (whose strength is reflected by the maximum Initial Trend value) from the weekly down price channel resistance trendline from the major resistance at 69.00 (former strong support which reversed the pair up in the March of 2008). The strength of this Pennant Breakout is rated at the maximum level – increasing the chances that SGD/JPY will fall further in the direction of the Forecast Price 60.84.

The following weekly SGD/JPY chart highlights the technical price levels mentioned above:


The following weekly SGD/JPY chart highlights the technical price levels mentioned above:

