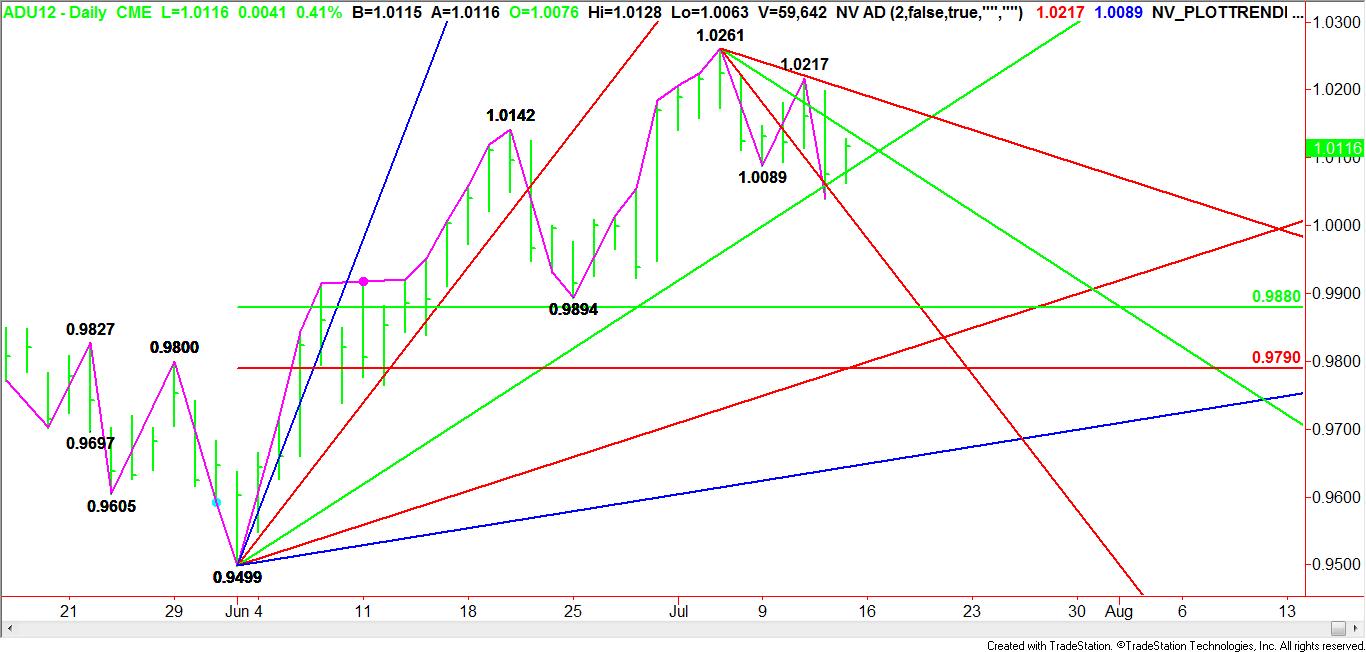
The September Australian Dollar is threatening to breakdown as the daily chart is beginning to show signs of developing weakness. The lack of demand for higher-yielding assets and the slowdown in the global economy are two key threats to the Aussie.
This morning the Aussie is up slightly, but earlier in the trading session it was under a little pressure after China’s gross domestic product slowed to 7.6% in the second quarter. The drop in growth wasn’t a surprise so the Aussie didn’t weaken too much against the U.S. Dollar, but it was not good enough to turn the market higher for the week.
This week’s risk-off trading scenario has encouraged selling of the Aussie since the Fed minutes released on Wednesday indicated that the central bank members were not in favor of additional stimulus at this time.
Adding to the potential weakness in the currency is talk that the Reserve Bank of Australia is poised to cut interest rates once again in August. This will be the fifth time since November that the central bank will have reduced rates in an effort to revive the economy.

The technical picture based on the daily chart pattern suggests that sentiment is shifting to the downside. Earlier this week the main trend turned down on the daily chart when the currency crossed the last swing bottom at 1.0089. A new lower top was formed at 1.0217, suggesting that sellers were taking control of the market.
Currently, the Aussie is straddling an uptrending Gann angle at 1.0079. Crossing to the bearish side of this angle could trigger the start of a sell-off. The daily chart also indicates that based on the main range of .9499 to 1.0261, the market could eventually breakdown into a retracement zone at .9880 to .9790.
Resistance is at 1.0141 today but this price isn’t as important as the swing top at 1.0217. A move through this price will be a sign that the trend is turning back to up.
At this time the focus should be on the slowdown in the global economy and the potential for a serious break according to the chart formation on the daily chart.
This morning the Aussie is up slightly, but earlier in the trading session it was under a little pressure after China’s gross domestic product slowed to 7.6% in the second quarter. The drop in growth wasn’t a surprise so the Aussie didn’t weaken too much against the U.S. Dollar, but it was not good enough to turn the market higher for the week.
This week’s risk-off trading scenario has encouraged selling of the Aussie since the Fed minutes released on Wednesday indicated that the central bank members were not in favor of additional stimulus at this time.
Adding to the potential weakness in the currency is talk that the Reserve Bank of Australia is poised to cut interest rates once again in August. This will be the fifth time since November that the central bank will have reduced rates in an effort to revive the economy.

The technical picture based on the daily chart pattern suggests that sentiment is shifting to the downside. Earlier this week the main trend turned down on the daily chart when the currency crossed the last swing bottom at 1.0089. A new lower top was formed at 1.0217, suggesting that sellers were taking control of the market.
Currently, the Aussie is straddling an uptrending Gann angle at 1.0079. Crossing to the bearish side of this angle could trigger the start of a sell-off. The daily chart also indicates that based on the main range of .9499 to 1.0261, the market could eventually breakdown into a retracement zone at .9880 to .9790.
Resistance is at 1.0141 today but this price isn’t as important as the swing top at 1.0217. A move through this price will be a sign that the trend is turning back to up.
At this time the focus should be on the slowdown in the global economy and the potential for a serious break according to the chart formation on the daily chart.
